. 2015 Apr 10;6(10):8155-66.
doi: 10.18632/oncotarget.2692.

Low dose radiation induced senescence of human mesenchymal stromal cells and impaired the autophagy process

Affiliations

Low dose radiation induced senescence of human mesenchymal stromal cells and impaired the autophagy process

Nicola Alessio et al. Oncotarget. .

Abstract

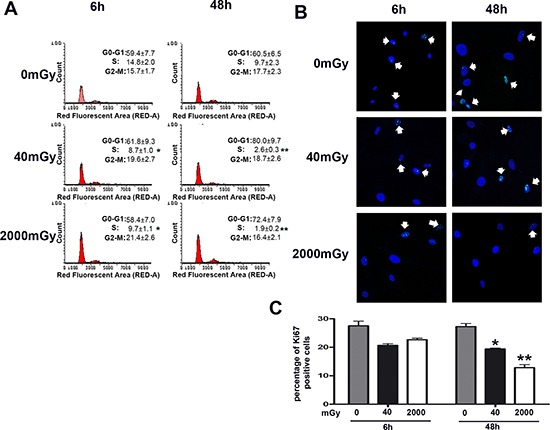
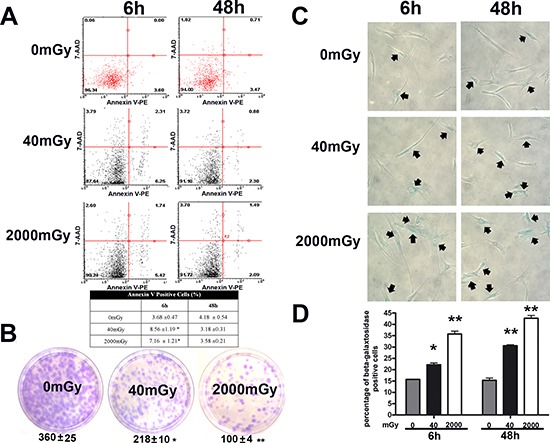
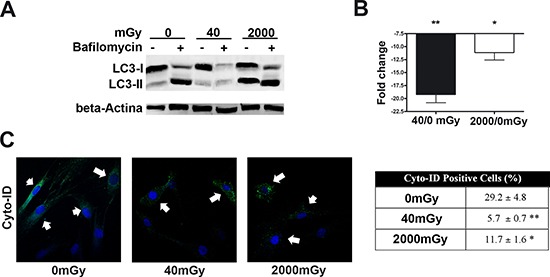
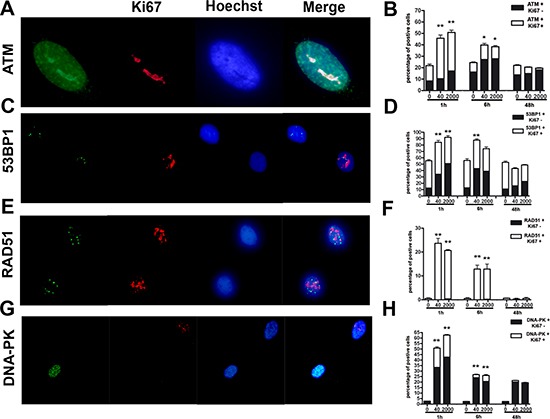
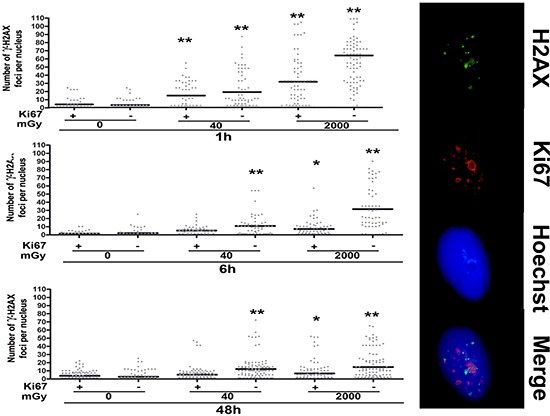
Low doses of radiation may have profound effects on cellular function. Individuals may be exposed to low doses of radiation either intentionally for medical purposes or accidentally, such as those exposed to radiological terrorism or those who live near illegal radioactive waste dumpsites.We studied the effects of low dose radiation on human bone marrow mesenchymal stromal cells (MSC), which contain a subpopulation of stem cells able to differentiate in bone, cartilage, and fat; support hematopoiesis; and contribute to body's homeostasis.The main outcome of low radiation exposure, besides reduction of cell cycling, is the triggering of senescence, while the contribution to apoptosis is minimal. We also showed that low radiation affected the autophagic flux. We hypothesize that the autophagy prevented radiation deteriorative processes, and its decline contributed to senescence.An increase in ATM staining one and six hours post-irradiation and return to basal level at 48 hours, along with persistent gamma-H2AX staining, indicated that MSC properly activated the DNA repair signaling, though some damages remained unrepaired, mainly in non-cycling cells. This suggested that the impaired DNA repair capacity of irradiated MSC seemed mainly related to the reduced activity of a non-homologous end-joining (NHEJ) system rather than HR (homologous recombination).

Keywords: mesenchymal stem cells; radiation; senescence.


Figures

Figure 1
Figure 1. Cell cycle analysis of irradiated MSC
Panel (A) – The picture shows representative FACS analysis of irradiated (40 and 2000 mGy) and control MSC. The experiments were carried out six and 48 hours post-irradiation. Experiments were conducted in triplicate for each condition. Percentage of different cell populations (G1, S and G2/M) are indicated. Data are expressed with standard deviation (n = 3, *p < 0.05, **p < 0.01). Panels (B, C) – Representative microscopic field of Ki67 immunostaining (green) on MSC six and 48 hours post-irradiation with 40 and 2000 mGy. Nuclei were counterstained with Hoechst 33342 (blue). Arrows indicate Ki67-positive cells. The graph shows the percentage of Ki67-positive cells. Data are expressed with standard deviation (n = 3, *p < 0.05, **p < 0.01).
Figure 2
Figure 2. Analysis of senescence, apoptosis, stemness and autophagy in irradiated MSCs
Panel (A) – Flow cytometry analysis of apoptosis with Nexin assay. The experiments were carried out six and 48 hours post-irradiation. The assay allows the identification of early (Annexin V + and 7ADD −) and late apoptosis (Annexin V + and 7ADD +). Nevertheless, apoptosis is a continuous process and we calculated the percentage of apoptosis as the sum of early and late apoptotic cells, to avoid a discretional separation between early and late apoptosis. The table shows the global percentage of Annexin V-positive cells. Data are expressed with standard deviation (n = 3, *p < 0.05). Panel (B) – CFU assay. The pictures show representative crystal violet staining of clones obtained after 14 days of incubation, with MSCs plated following irradiation experiments. The mean number of clones per 1,000 cells plated in 100 mm dish (± SD, n = 3, *p < 0.05, **p < 0.01) is indicated below each picture. Panels (C, D) – Senescence assay. Representative microscopic fields of acid beta-galactosidase (blue) in irradiated and control cells are shown. Arrows indicate senescent cells. The graph shows mean percentage value of senescent cells (± SD, n = 3, *p < 0.05).
Figure 3
Figure 3. Autophagy detection assays
Panels (A, B) – The picture shows western blot detection of LC3-I and LC3-II in irradiated and control MSC. Following irradiation (40 and 2000 mGy), cells were incubated for six hours and then harvested for western blot analysis. Two hours before the end of cell sample preparation, irradiated and control MSC cultures were incubated with 100 nM Bafilomycin A1 (inhibitor of lysosomal degradation) or PBS to detect autophagic flux. We used Gel Doc 2000 Gel Documentation Systems (Bio-Rad, CA, USA) to measure LC3-I and II band intensities that were normalized with beta-actin (chosen as loading control). We determined autophagic flux (AF) for LC3 II as follows: IR-treated MSC AF = (IR-treated MSC + Bafylomycin A1) - (IR treated MSC + PBS); Control MSCs AF = (Control MSC + Bafylomycin A1) - (Control MSC + PBS). Change in autophagic flux (ΔAF) between IR-treated and control MSC was calculated as ΔAF = IR-treated MSC AF - Control MSC AF. The graph shows AF changes in IR-treated MSC compared to control cultures. Data are expressed in change folds (n = 3; *p < 0.05). Panel (C) – Cyto-ID assay. Representative microscopic fields of cells with active autophagy (green) in irradiated and control cells are shown. Nuclei were counterstained with Hoechst 33342 (blue). Arrows indicate Cyto-ID-positive cells. The table shows mean percentage value of Cyto-ID-positive cells (± SD, n = 3, *p < 0.05, **p < 0.01).
Figure 4
Figure 4. Evaluation of DNA damage and repair
Panels (A, B) – ATM immunostaining. Fluorescence photomicrographs shows a typical cell stained with anti-ATM (green) and Ki67 (red). Nuclei were counterstained with Hoechst 33342 (blue). A representative microscopic field for each treatment is shown. The mean percentage of ATM- and Ki67-positive cells is indicated in the graph (± SD, n = 3, *p < 0.05). Panels (C, D) – 53BP1 immunostaining. Fluorescence photomicrographs show cells stained with anti-53BP1 (green) and Ki67 (red). Nuclei were counterstained with Hoechst 33342 (blue). A representative microscopic field for each treatment is shown. The mean percentage of 53BP1- and Ki67-positive cells is indicated in the graph (± SD, n = 3, *p < 0.05). Panels (E, F) – RAD51 immunostaining. Fluorescence photomicrographs show cells stained with anti-RAD51 (green) and Ki67 (red). Nuclei were counterstained with Hoechst 33342 (blue). A representative microscopic field for each treatment is shown. The mean percentage of RAD51- and Ki67-positive cells is indicated in the graph (± SD, n = 3, *p < 0.05). Panels (G, H) – DNA-PK immunostaining. Fluorescence photomicrographs show cells stained with anti-DNA-PK (green) and Ki67 (red). Nuclei were counterstained with Hoechst 33342 (blue). A representative microscopic field for each treatment is shown. The mean percentage of DNA-PK- and Ki67-positive cells is indicated in the graph (± SD, n = 3, *p < 0.05).
Figure 5
Figure 5. Gamma H2AX staining
Fluorescence photomicrographs show the merging of cells stained with anti-H2AX (green), anti Ki-67 (red) and Hoechst 33342 (blue). A representative microscopic field for each treatment is shown. – Graph shows the degree of H2AX phosphorylation. This was evaluated by counting the number of gamma-H2AX immunofluorescent foci per cell. Foci number was determined for 200 cells. Each dot represents an individual cell. Black bars indicate mean value for each category (n = 3, *p < 0.05, **p < 0.01).

References

    1. Rando TA. Stem cells, ageing and the quest for immortality. Nature. 2006;441:1080–1086. - PubMed
    1. Sperka T, Wang J, Rudolph KL. DNA damage checkpoints in stem cells, ageing and cancer. Nature reviews Molecular cell biology. 2012;13:579–590. - PubMed
    1. Capasso S, Alessio N, Di Bernardo G, Cipollaro M, Melone MA, Peluso G, Giordano A, Galderisi U. Silencing of RB1 and RB2/P130 during adipogenesis of bone marrow stromal cells results in dysregulated differentiation. Cell cycle. 2014;13:482–490. - PMC - PubMed
    1. Chua HL, Plett PA, Sampson CH, Joshi M, Tabbey R, Katz BP, MacVittie TJ, Orschell CM. Long-term hematopoietic stem cell damage in a murine model of the hematopoietic syndrome of the acute radiation syndrome. Health physics. 2012;103:356–366. - PMC - PubMed
    1. Cmielova J, Havelek R, Soukup T, Jiroutova A, Visek B, Suchanek J, Vavrova J, Mokry J, Muthna D, Bruckova L, Filip S, English D, Rezacova M. Gamma radiation induces senescence in human adult mesenchymal stem cells from bone marrow and periodontal ligaments. International journal of radiation biology. 2012;88:393–404. - PubMed

Publication types