. 2015 Jan 30;6(3):1435-45.
doi: 10.18632/oncotarget.2935.

Intravital imaging reveals p53-dependent cancer cell death induced by phototherapy via calcium signaling

Affiliations

Intravital imaging reveals p53-dependent cancer cell death induced by phototherapy via calcium signaling

Carlotta Giorgi et al. Oncotarget. .

Abstract

One challenge in biology is signal transduction monitoring in a physiological context. Intravital imaging techniques are revolutionizing our understanding of tumor and host cell behaviors in the tumor environment. However, these deep tissue imaging techniques have not yet been adopted to investigate the second messenger calcium (Ca²⁺). In the present study, we established conditions that allow the in vivo detection of Ca²⁺ signaling in three-dimensional tumor masses in mouse models. By combining intravital imaging and a skinfold chamber technique, we determined the ability of photodynamic cancer therapy to induce an increase in intracellular Ca²⁺ concentrations and, consequently, an increase in cell death in a p53-dependent pathway.


Conflict of interest statement

Conflict of interest

The authors declare no conflicts of interest related to this work.

Figures

Figure 1
Figure 1. Defective Ca2+ homeostasis and apoptosis due to a lack of p53
(A) Generation of H-RASv12-transduced MEF clones. (B) Anchorage-independent growth of H-RASv12-transduced MEFs (p53+/+ clone and p53−/− clone). Pictures in the upper part are representative of colonies formed. For each well all colonies larger then 0.1 mm in diameter were counted using ImageJ software. (C) Mitochondrial Ca2+ response obtained with a mitochondria-targeted aequorin chimera after agonist stimulation with ATP (100 μM) (p53+/+ clone: [Ca2+]m peak 6.23 ± 0.44; p53−/− clone: [Ca2+]m peak 2.99 ± 0.21) (p < 0.01). (D) Representative traces of mitochondrial Ca2+ transient. (E) Apoptotic sensitivity of H-RASv12-transduced MEF clones (500 μM H2O2 for 6 hours). (F) Cytosolic Ca2+ response of H-RASv12-transduced MEF clones loaded with Fura-2 dye upon phthalocyanine (15 μM) photo-activation with visible (red) light from a 650 nm light emitting diode (LED). Microscopic fields of analyzed cells. (G) The ratio of Fura-2 fluorescence 340 nm/380 nm averaged with the color-matched regions of interest (ROIs) shown in (F), accompanied by statistical analysis. (H) Cell death analysis using the percentage of pyknotic nuclei in H-RASv12-transduced MEF clones upon phthalocyanine (15 μM) photo-activation.
Figure 2
Figure 2. Intravital Ca2+ imaging in tumor masses
(A) Schematic representation of the skinfold chamber technique used to allow tumor formation and subsequent analysis by ratiometric confocal spinning disk intravital microscopy. (B) Representative images of tumor masses originated by the indicated H-RASv12-transduced MEF clones (p53+/+ and p53−/− clones) injected in athymic mice. (C) Cytosolic Ca2+ response measured within the tumors obtained by H-RASv12-transduced MEF clones injected into skinfold chambers mounted on athymic mice. Microscopic fields of analyzed cells. (D) The ratio of Fura-2 fluorescence 340 nm/380 nm accompanied by statistical analysis.
Figure 3
Figure 3. Increased Ca2+ response in p53−/− MEF clones after MCU overexpression restores sensitivity to PDT
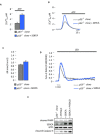
(A) Mitochondrial Ca2+ response after agonist (100 μM ATP) stimulation of p53−/− MEF clone in resting condition or after MCU overexpression (p53−/− clone: [Ca2+]m peak 2.20 ± 0.45; p53−/− clone + MCU: [Ca2+]m peak 8.28 ± 1.45) (p < 0.01). (B) Representative traces of mitochondrial Ca2+ transient. (C) and (D) Single-cell FRET measurements of PDT-induced mitochondrial Ca2+ uptake that are expressed as the maximal variation in the emission ratio (p53−/− clone: ΔR max 0.0311 ± 0.0043; p53−/− clone + MCU: ΔR max 0.0512 ± 0.0054) (p < 0.05). (E) Immunoblotting for typical apoptotic markers in p53−/− clone upon phthalocyanine (15 μM) photo-activation (PHTALO).
Figure 4
Figure 4. Increased Ca2+ response in p53−/− MEF clones after SERCA overexpression restores sensitivity to PDT
(A) Mitochondrial Ca2+ response after agonist (100 μM ATP) stimulation of p53−/− clone in resting condition or after SERCA overexpression (p53−/− clone: [Ca2+]m peak 2.51 ± 0.31; p53−/− clone + SERCA: [Ca2+]m peak 5.40 ± 0.56) (p < 0.01). (B) Representative traces of mitochondrial Ca2+ transient. (C) and (D) Ratiometric single-cell measurements of PDT-induced Ca2+ waves by Fura-2 that are expressed as the maximal variation in the excitation ratio (p53−/− clone: ΔR max 0.85 ± 0.02; p53−/− clone + SERCA: ΔR max 1.05 ± 0.06) (p < 0.01). (E) Immunoblotting for typical apoptotic markers in p53−/− clone upon phthalocyanine (15 μM) photo-activation (PHTALO).
Figure 5
Figure 5. Reduced Ca2+ response in p53+/+ MEF clones with a Ca2+ chelator blocks the sensitivity to PDT
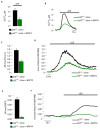
(A) Mitochondrial Ca2+ response after agonist (100 μM ATP) stimulation of p53+/+ clone in resting condition or after BAPTA-AM loading (p53+/+ clone: [Ca2+]m peak 6.33 ± 0.97; p53+/+ clone + BAPTA: [Ca2+]m peak 2.59 ± 0.83) (p < 0.05). (B) Representative traces of mitochondrial Ca2+ transient. (C) and (D) Ratiometric single-cell measurements of PDT-induced Ca2+ waves by Fura-2 that are expressed as the maximal variation in the excitation ratio (p53+/+ clone: ΔR max 1.35 ± 0.07; p53+/+ clone + BAPTA: ΔR max 0.63 ± 0.04) (p < 0.01). (E) and (F) Single-cell FRET measurements of PDT-induced mitochondrial Ca2+ uptake that are expressed as the maximal variation in the emission ratio (p53+/+ clone: ΔR max 0.0824 ± 0.0102; p53+/+ clone + BAPTA: ΔR max 0.0048 ± 0.0045) (p < 0.01). (G) Immunoblotting for typical apoptotic markers in p53+/+ clone upon phthalocyanine (15 μM) photo-activation (PHTALO).
Figure 6
Figure 6. Ca2+ signal in tumor masses is required for the anticancer effect of PDT
(A) Cytosolic Ca2+ response measured within the tumors in the skinfold chambers as the ratio of Fura-2 fluorescence 340 nm/380 nm induced upon phthalocyanine (15 μM) photo-activation. (B) Levels of apoptosis measured as caspase activity (SR-FLIVO) within the tumor masses in the skinfold chambers. (C) In vivo imaging of apoptosis as the intensity of fluorescence (SR-FLIVO) emitted by a subcutaneous tumor mass upon phthalocyanine (15 μM) photo-activation. (D) Analysis of apoptosis in tumor tissue sections prepared upon in vivo phthalocyanine (15 μM) photo-activation and tumor excision. (E) Immunoblotting of homogenized tumors excised upon in vivo phthalocyanine (15 μM) photo-activation.

Comment in

References

    1. Miliani de Marval PL, Zhang Y. The RP-Mdm2-p53 pathway and tumorigenesis. Oncotarget. 2011;2(3):234–238. - PMC - PubMed
    1. Orrenius S, Zhivotovsky B, Nicotera P. Regulation of cell death: the calcium-apoptosis link. NatRevMolCell Biol. 2003;4(7):552–565. - PubMed
    1. Giorgi C, Baldassari F, Bononi A, Bonora M, De Marchi E, Marchi S, Missiroli S, Patergnani S, Rimessi A, Suski JM, Wieckowski MR, Pinton P. Mitochondrial Ca(2+) and apoptosis. Cell Calcium. 2012;52(1):36–43. - PMC - PubMed
    1. Rudolf R, Mongillo M, Magalhaes PJ, Pozzan T. In vivo monitoring of Ca(2+) uptake into mitochondria of mouse skeletal muscle during contraction. J Cell Biol. 2004;166(4):527–536. - PMC - PubMed
    1. Pinton P, Ferrari D, Rapizzi E, Di Virgilio FD, Pozzan T, Rizzuto R. The Ca2+ concentration of the endoplasmic reticulum is a key determinant of ceramide-induced apoptosis: significance for the molecular mechanism of Bcl-2 action. EMBO J. 2001;20(11):2690–2701. - PMC - PubMed

Publication types

Substances