

Top-down but not bottom-up visual scanning is affected in hereditary pure cerebellar ataxia
- PMID: 25545148
- PMCID: PMC4278854
- DOI: 10.1371/journal.pone.0116181
Top-down but not bottom-up visual scanning is affected in hereditary pure cerebellar ataxia
Abstract
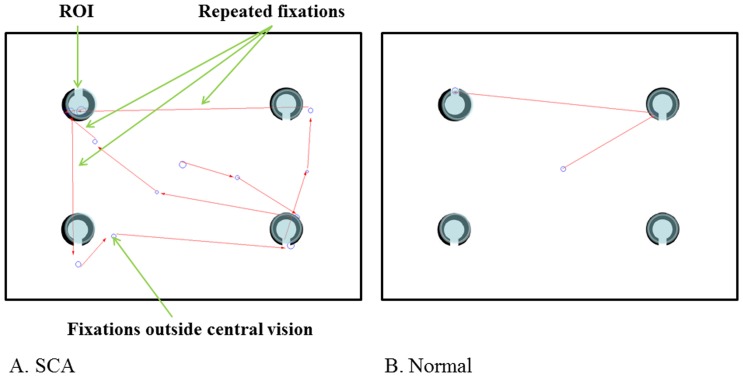
The aim of this study was to clarify the nature of visual processing deficits caused by cerebellar disorders. We studied the performance of two types of visual search (top-down visual scanning and bottom-up visual scanning) in 18 patients with pure cerebellar types of spinocerebellar degeneration (SCA6: 11; SCA31: 7). The gaze fixation position was recorded with an eye-tracking device while the subjects performed two visual search tasks in which they looked for a target Landolt figure among distractors. In the serial search task, the target was similar to the distractors and the subject had to search for the target by processing each item with top-down visual scanning. In the pop-out search task, the target and distractor were clearly discernible and the visual salience of the target allowed the subjects to detect it by bottom-up visual scanning. The saliency maps clearly showed that the serial search task required top-down visual attention and the pop-out search task required bottom-up visual attention. In the serial search task, the search time to detect the target was significantly longer in SCA patients than in normal subjects, whereas the search time in the pop-out search task was comparable between the two groups. These findings suggested that SCA patients cannot efficiently scan a target using a top-down attentional process, whereas scanning with a bottom-up attentional process is not affected. In the serial search task, the amplitude of saccades was significantly smaller in SCA patients than in normal subjects. The variability of saccade amplitude (saccadic dysmetria), number of re-fixations, and unstable fixation (nystagmus) were larger in SCA patients than in normal subjects, accounting for a substantial proportion of scattered fixations around the items. Saccadic dysmetria, re-fixation, and nystagmus may play important roles in the impaired top-down visual scanning in SCA, hampering precise visual processing of individual items.
Conflict of interest statement
Figures


Similar articles
-
Visual scanning area is abnormally enlarged in hereditary pure cerebellar ataxia.Cerebellum. 2015 Apr;14(2):63-71. doi: 10.1007/s12311-014-0600-5. Cerebellum. 2015. PMID: 25231433
-
Differences in saccade dynamics between spinocerebellar ataxia 2 and late-onset cerebellar ataxias.Brain. 2011 Mar;134(Pt 3):879-91. doi: 10.1093/brain/awr009. Brain. 2011. PMID: 21354979
-
Early top-down control over saccadic target selection: Evidence from a systematic salience difference manipulation.Atten Percept Psychophys. 2014 Feb;76(2):367-82. doi: 10.3758/s13414-013-0592-0. Atten Percept Psychophys. 2014. PMID: 24323673 Clinical Trial.
-
Guided Search 6.0: An updated model of visual search.Psychon Bull Rev. 2021 Aug;28(4):1060-1092. doi: 10.3758/s13423-020-01859-9. Epub 2021 Feb 5. Psychon Bull Rev. 2021. PMID: 33547630 Free PMC article. Review.
-
Biasing Allocations of Attention via Selective Weighting of Saliency Signals: Behavioral and Neuroimaging Evidence for the Dimension-Weighting Account.Curr Top Behav Neurosci. 2019;41:87-113. doi: 10.1007/7854_2018_75. Curr Top Behav Neurosci. 2019. PMID: 30588570 Review.
Cited by
-
Characteristics of Visual Cognition in Patients with Anoxic Encephalopathy: An Eye-tracking Study.Prog Rehabil Med. 2024 Jul 30;9:20240024. doi: 10.2490/prm.20240024. eCollection 2024. Prog Rehabil Med. 2024. PMID: 39081543 Free PMC article.
-
Early detection of cognitive decline in Alzheimer's disease using eye tracking.Front Aging Neurosci. 2023 Mar 21;15:1123456. doi: 10.3389/fnagi.2023.1123456. eCollection 2023. Front Aging Neurosci. 2023. PMID: 37025964 Free PMC article.
-
Operation of a P300-based brain-computer interface by patients with spinocerebellar ataxia.Clin Neurophysiol Pract. 2017 Jul 3;2:147-153. doi: 10.1016/j.cnp.2017.06.004. eCollection 2017. Clin Neurophysiol Pract. 2017. PMID: 30214988 Free PMC article.
-
Quantitative Oculomotor Assessment in Hereditary Ataxia: Discriminatory Power, Correlation with Severity Measures, and Recommended Parameters for Specific Genotypes.Cerebellum. 2024 Feb;23(1):121-135. doi: 10.1007/s12311-023-01514-8. Epub 2023 Jan 14. Cerebellum. 2024. PMID: 36640220 Free PMC article.
-
A simple saccadic reading test to assess ocular motor function in cerebellar ataxia.PLoS One. 2018 Nov 7;13(11):e0203924. doi: 10.1371/journal.pone.0203924. eCollection 2018. PLoS One. 2018. PMID: 30403759 Free PMC article. Clinical Trial.
References
-
- Schmahmann JD, Sherman JC (1998) The cerebellar cognitive affective syndrome. Brain 121:561–579. - PubMed
-
- Ramnani N (2006) The primate cortico-cerebellar system: anatomy and function. Nat Rev Neurosci 7:511–522. - PubMed
-
- Kawai Y, Suenaga M, Watanabe H, Ito M, Kato K, et al. (2008) Prefrontal hypoperfusion and cognitive dysfunction correlates in spinocerebellar ataxia type 6. J Neurol Sci 271:68–74. - PubMed
-
- Suenaga M, Kawai Y, Watanabe H, Atsuta N, Ito M, et al. (2008) Cognitive impairment in spinocerebellar ataxia type 6. J Neurol Neurosurg Psychiatry 79:496–499. - PubMed
Publication types
MeSH terms
LinkOut - more resources
Full Text Sources
Other Literature Sources
