. 2015 Mar 1;593(5):1213-38.
doi: 10.1113/jphysiol.2014.283648. Epub 2015 Feb 4.

Inward rectifier potassium currents in mammalian skeletal muscle fibres

Affiliations

Inward rectifier potassium currents in mammalian skeletal muscle fibres

Marino DiFranco et al. J Physiol. .

Abstract

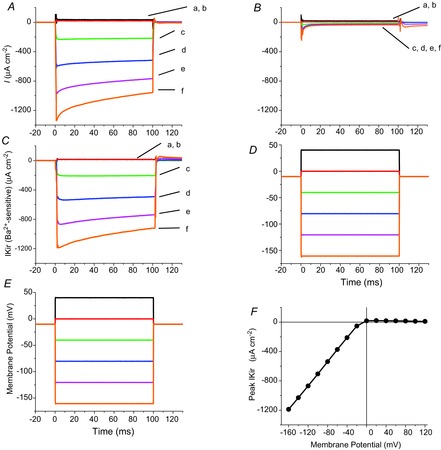
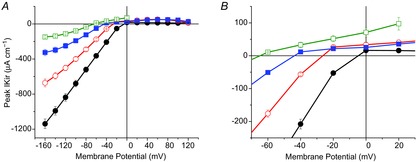
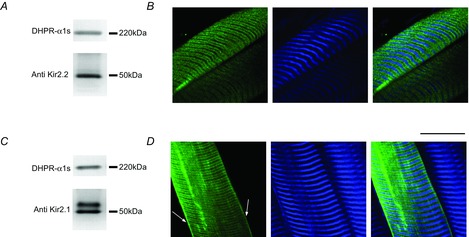
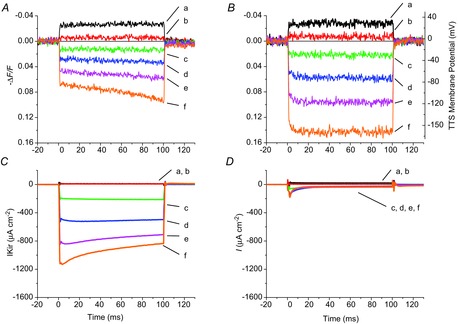
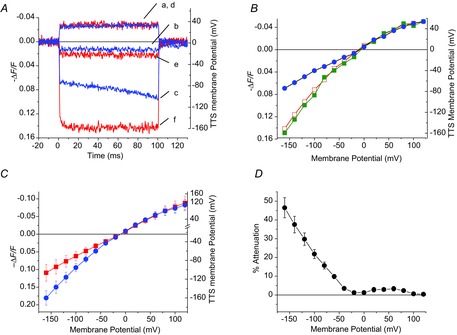
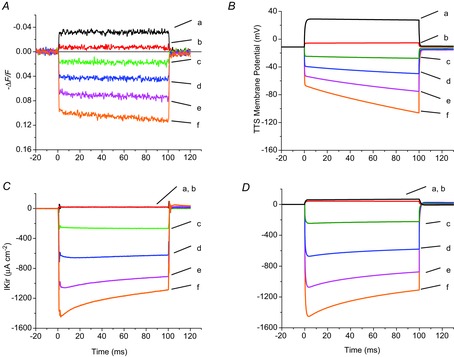
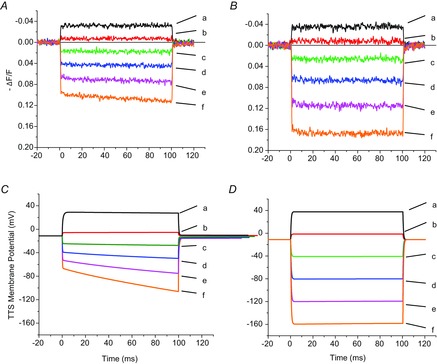
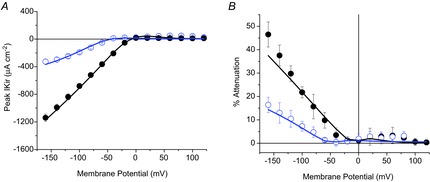
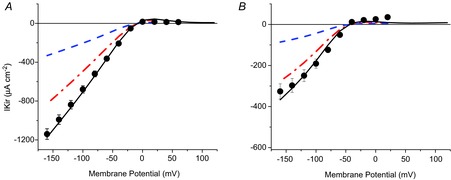
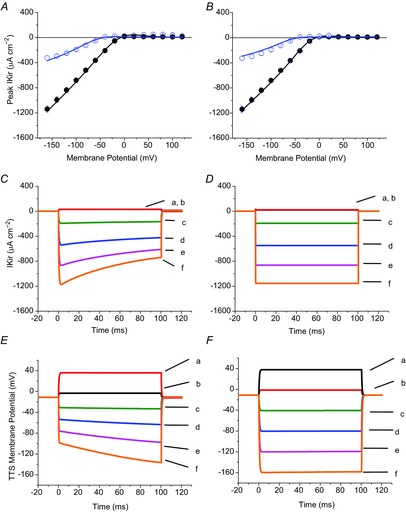
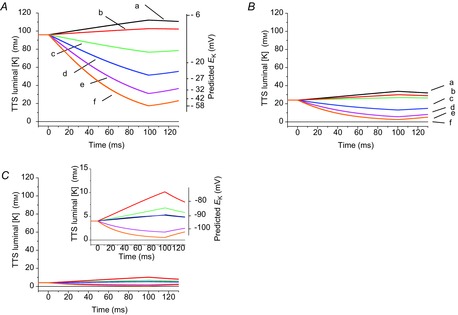
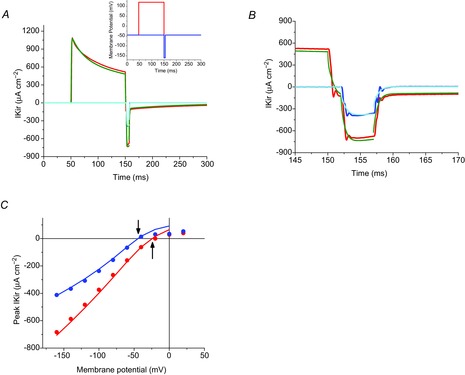
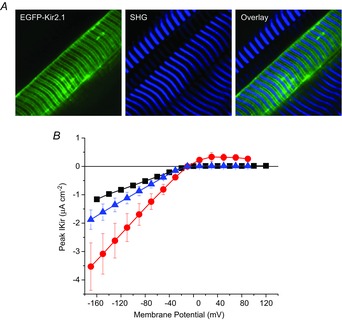
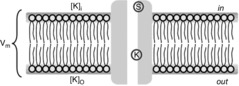
Inward rectifying potassium (Kir) channels play a central role in maintaining the resting membrane potential of skeletal muscle fibres. Nevertheless their role has been poorly studied in mammalian muscles. Immunohistochemical and transgenic expression were used to assess the molecular identity and subcellular localization of Kir channel isoforms. We found that Kir2.1 and Kir2.2 channels were targeted to both the surface and the transverse tubular system membrane (TTS) compartments and that both isoforms can be overexpressed up to 3-fold 2 weeks after transfection. Inward rectifying currents (IKir) had the canonical features of quasi-instantaneous activation, strong inward rectification, depended on the external [K(+)], and could be blocked by Ba(2+) or Rb(+). In addition, IKir records show notable decays during large 100 ms hyperpolarizing pulses. Most of these properties were recapitulated by model simulations of the electrical properties of the muscle fibre as long as Kir channels were assumed to be present in the TTS. The model also simultaneously predicted the characteristics of membrane potential changes of the TTS, as reported optically by a fluorescent potentiometric dye. The activation of IKir by large hyperpolarizations resulted in significant attenuation of the optical signals with respect to the expectation for equal magnitude depolarizations; blocking IKir with Ba(2+) (or Rb(+)) eliminated this attenuation. The experimental data, including the kinetic properties of IKir and TTS voltage records, and the voltage dependence of peak IKir, while measured at widely dissimilar bulk [K(+)] (96 and 24 mm), were closely predicted by assuming Kir permeability (PKir) values of ∼5.5 × 10(-6 ) cm s(-1) and equal distribution of Kir channels at the surface and TTS membranes. The decay of IKir records and the simultaneous increase in TTS voltage changes were mostly explained by K(+) depletion from the TTS lumen. Most importantly, aside from allowing an accurate estimation of most of the properties of IKir in skeletal muscle fibres, the model demonstrates that a substantial proportion of IKir (>70%) arises from the TTS. Overall, our work emphasizes that measured intrinsic properties (inward rectification and external [K] dependence) and localization of Kir channels in the TTS membranes are ideally suited for re-capturing potassium ions from the TTS lumen during, and immediately after, repetitive stimulation under physiological conditions.


Figures

Figure 1
Figure 1
Potassium inward rectifying currents in adult FDB fibres A, membrane currents in response to 100 ms voltage-clamp pulses recorded from an FDB fibre in the presence of 96 mm [K+]. Pulses were to +40, +20, −40, −80, −120 and −160 mV in traces a–f, respectively. B, membrane currents recorded after adding 1 mm Ba2+ to the external solution. Note that most currents seen in control conditions are blocked. C, Ba2+-sensitive currents (IKir) obtained by subtracting equivalent traces in A and B. D and E, membrane potential traces, as recorded by the voltage electrode simultaneously with the traces in A and C, respectively. F, voltage dependence of the peak (onset) IKir in C.
Figure 2
Figure 2
Effects of the extracellular K+ concentration on the slope and reversal potential of IKir A, voltage dependence of the peak IKir recorded in fibres bathed with external solutions containing 96 mm (filled circles), 48 mm (open circles), 24 mm (filled squares) and 12 mm (open squares) [K+]o. The symbols are connec-ted with lines of the same colour, and the bars represent SEM. B, enlarged section of the plot in A to show the leftward shift of reversal potential of the currents in response to reduced [K+]o. The reversal potentials for 96, 48, 24 and 12 mm were −4.5, −26, −43 and −64 mV, respectively. The corresponding theoretical EK values were (in mV): −11 (filled circles), −24 (open circles), −46 (filled squares) and −64 (open squares).
Figure 3
Figure 3
Expression and subcellular localization of native Kir channel in FDB muscles A and C, Western blot analysis of Kir2.2 and Kir2.1 expression, respectively. The dihydropyridine receptor was used as a loading control. B and D, TPLSM analysis of the targeting of Kir2.2 and Kir2.1, respectively. For both sets of data, panels 1 and 2 are the images of the fluorescence of the secondary antibodies and the corresponding backscattered second harmonic generation signal, respectively. The overlay of equivalent images is shown in the corresponding panel 3. Arrows indicate surface expression of Kir2.1.
Figure 4
Figure 4
Effect of IKir activation on voltage-dependent di-8-ANEPPS transients A and B, di-8-ANEPPS transients elicited by step voltage clamp pulses (to +40,+20, −40, −80, −120 and −160 mV) are represented by traces a–f, respectively, efore (A) and after (B) blocking IKir. C and D, corresponding currents for A and B, respectively. Fibre diameter, 59 μm; length, 556 μm; capacitance, 5.9 μF cm−2.
Figure 5
Figure 5
Voltage dependence of di-8-ANEPPS transient attenuation A, comparison of di-8-ANEPPS transients elicited by voltage pulses (to +40, −40 and −160 mV), before (traces a, b and c, respectively) and after blocking IKir (traces d, e and f, respectively). B, peak (at the onset of traces) ΔF/F as a function of membrane potential calculated from records obtained in the same fibre as in A. The data were obtained in the presence of 96 mm [K+] before and after adding 1 mm [Ba2+] (filled circles and open squares, respectively), and after exchanging the K+-based external solution with a TEA+-based solution (filled squares). C, average peak (at the onset of traces) ΔF/F as a function of membrane potential, calculated from data obtained from eight fibres. D, voltage dependence of the attenuation of di-8-ANEPPS transients by activation of IKir. The symbols and bars in C and D represents the mean and SD.
Figure 6
Figure 6
Model simulation of TTS membrane potential and IKir in response to voltage clamp pulses A and C, experimental di-8-ANEPPS transients (A) and total IKir (C) recorded in a fibre bathed in 96 mm extracellular [K+]. B and D, model predictions of the average (along the radius) TTS membrane potential and total IKir. For all panels, the responses to pulses to +40, +20, −40, −80, −120 and −160 mV are represented by traces a–f, respectively. Fibre diameter, 56 μm; length, 497 μm; capacitance, 6.5 μF cm−2. See text for details.
Figure 7
Figure 7
Model prediction of the effect of blocking IKir on the di-8-ANEPPS recorded in the presence of 96 mm extracellular [K+] A and B, di-8-ANEPPS transients recorded in response to voltage pulses (to +40, +20, −40, −80, −120 and −160 mV) represented by traces a–f, respectively, before (A) and after (B) blocking IKir with 1 mm [Ba2+]. C and D, predicted average TTS membrane potential in response to the same pulses as in A and B, respectively. PKir = 7.5 × 10−6 cm s−1; S/TTS = 1.
Figure 8
Figure 8
Simultaneous model prediction of peak IKir and optical attenuation for two extracellular [K+] A, model predictions (continuous lines) of the experimental peak IKir (symbols) recorded in a fibre exposed to 96 mm (filled circles) and 24 mm (open circles) [K+]o. B, model predictions (continuous lines) of the percentage peak attenuation, calculated from the same fibres as in A (symbols and error bars). PKir = 5.5 × 10−6 cm s−1; S/TTS = 1.
Figure 9
Figure 9
Model simulation of the IKir arising from the surface and TTS membranes A, model predictions (continuous lines) of the total peak IKir (symbols and error bars) of fibres exposed to 96 mm [K+]o. The predicted IKir contributions from the TTS and surface membranes are represented by the dash-dot and dashed lines, respectively. B, as for A, but for 24 mm [K+]o. PKir = 7.5 × 10−6 cm s−1; S/TTS = 1.
Figure 10
Figure 10
Comparative model simulations of IKir and TTS membrane potential changes using two PKir distributions A, model predictions (continuous lines) of peak IKir recorded in 24 mm (open circles and error bars) and 96 mm extracellular [K+] (filled circles with bars). PKir = 5.5 × 10−6 cm s−1; S/TTS = 1. B, model predictions of the same data as in A, but assuming that Kir channels are exclusively located at the surface membrane. PKir = 2 × 10−5 cm s−1; S/TTS = 0. C and D, simulated IKir traces assuming the conditions in A and B, respectively. The traces are calculated in response to voltage clamp pulses to +40, +20, −40, −80, −120 and −160 mV (traces a–f, respectively). E and F, time course of average TTS membrane potential changes calculated in response to the same pulses as in C and D.
Figure 11
Figure 11
IKir activation leads to reductions in the TTS luminal [K+] A, model predictions of TTS luminal [K+] changes (left ordinate axis) in response to pulses to +20, 0, −40, −80, −120 and −160 mV (traces a–f, respectively) in a fibre exposed to a bulk [K+]o = 96 mm. The right ordinate axis shows the predicted EK from the TTS luminal [K+]. B, luminal [K+] changes for the same fibre in 24 mm [K+]o. Pulses to the same values as in A were used. C, luminal [K+] changes in response to the same values as in A, but predicted for a fibre exposed to 4 mm [K+]o. The traces are shown in a narrower [K+] scale in the inset, which also includes the predicted values for EK. PKir = 5.5 × 10−6 cm s−1; S/TTS = 1. In all panels the solid horizontal lines indicate the luminal [K+] prior to pulse application (equal to bulk [K+]o).
Figure 12
Figure 12
Model predictions of K+ accumulation in the TTS A, inset: a two-pulse experiment used to activate both the delayed and the inward K+ rectifier currents in a fibre bathed in 24 mm extracellular [K+]. A conditioning pulse to 120 mV (red trace, 100 ms) was followed by a short (5 ms) test pulse to −160 mV (blue trace). The test pulse was applied in the absence of conditioning pulse. The main plot shows: (1) the experimental (red trace) and model predicted currents (green trace) in response to the overall pulse paradigm; and (2) the experimental (blue trace) and model predicted currents (cyan trace) in response to the test pulse alone. B, a portion of the same traces as in A, but displayed at an expanded scale. C, Voltage dependence of the tail currents (IKir) in response to test pulses ranging from −160 to 40 mV (every 20 mV) recorded in the presence (blue symbols) and in the absence (red symbols and lines) of a 120 mV conditioning pulse. The blue and red lines correspond to the model predictions of the tail currents calculated with and without conditioning pulse, respectively. The arrows indicate estimated reversal potentials. Model predictions: PKir = 6.8 × 10−6 cm s−1; S/TTS = 1. Fibre diameter, 57 μm; length, 429 μm; capacitance, 4.6 μF cm−2.
Figure 13
Figure 13
Transgenic Kir2.1 and Kir2.2 are functionally expressed in adult FDB fibres A, subcellular localization of transgenic EGFP-Kir2.1. Left and centre panels are TPLSM images of the EGFP fluorescence and the backscattered SHG signal from the myosin, respectively. The left panel is the overlay of the right and centre panels. Images were taken from a live muscle 12 days after transfection. B, voltage dependence of peak IKir from naïve fibres (black symbols, n = 12), and fibres expressing either EGFP-Kir2.1 (red symbols, n = 3) or EGFP-Kir2.2 (blue symbols, n = 4). The symbols and bars represent the mean ± SEM.
Figure 14
Figure 14
Modified GHK model of Kir channel

References

    1. Adrian RH, Chandler WK. Hodgkin AL. The kinetics of mechanical activation in frog muscle. J Physiol. 1969a;204:207–230. - PMC - PubMed
    1. Adrian RH, Costantin LL. Peachey LD. Radial spread of contraction in frog muscle fibres. J Physiol. 1969b;204:231–257. - PMC - PubMed
    1. Adrian RH. Peachey LD. Reconstruction of the action potential of frog sartorius muscle. J Physiol. 1973;235:103–131. - PMC - PubMed
    1. Almers W. The decline of potassium permeability during extreme hyperpolarization in frog skeletal muscle. J Physiol. 1972a;225:57–83. - PMC - PubMed
    1. Almers W. Potassium conductance changes in skeletal muscle and the potassium concentration in the transverse tubules. J Physiol. 1972b;225:33–56. - PMC - PubMed

Publication types

MeSH terms

LinkOut - more resources