. 2015 Feb;26(2):114-26.
doi: 10.1089/hum.2014.111.

Fanconi anemia gene editing by the CRISPR/Cas9 system

Affiliations

Fanconi anemia gene editing by the CRISPR/Cas9 system

Mark J Osborn et al. Hum Gene Ther. 2015 Feb.

Abstract

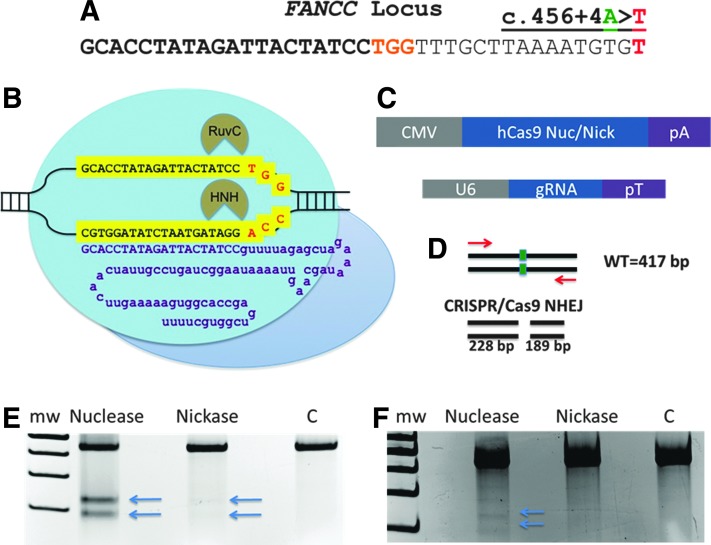
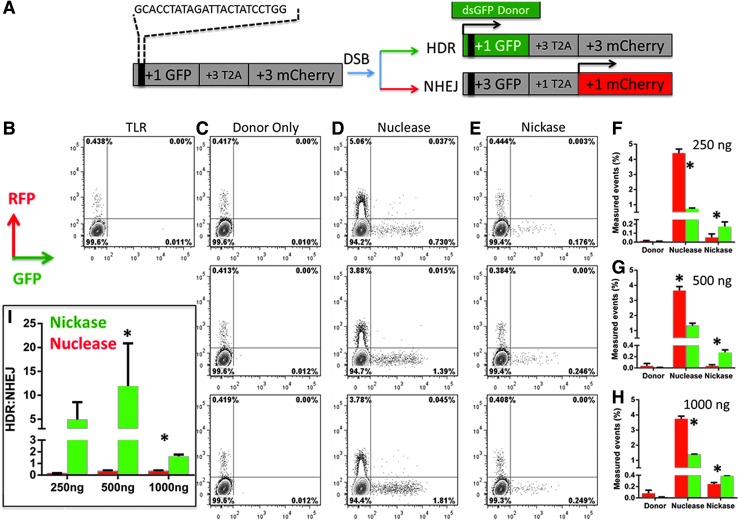
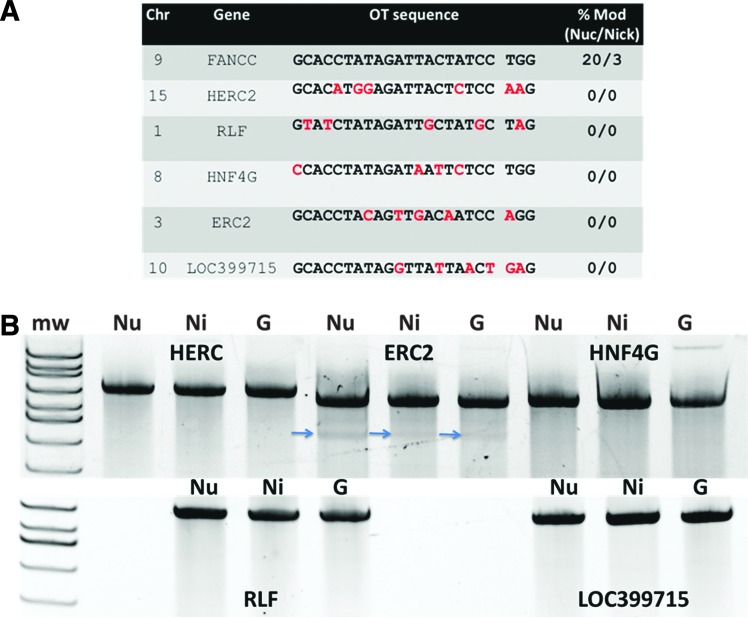
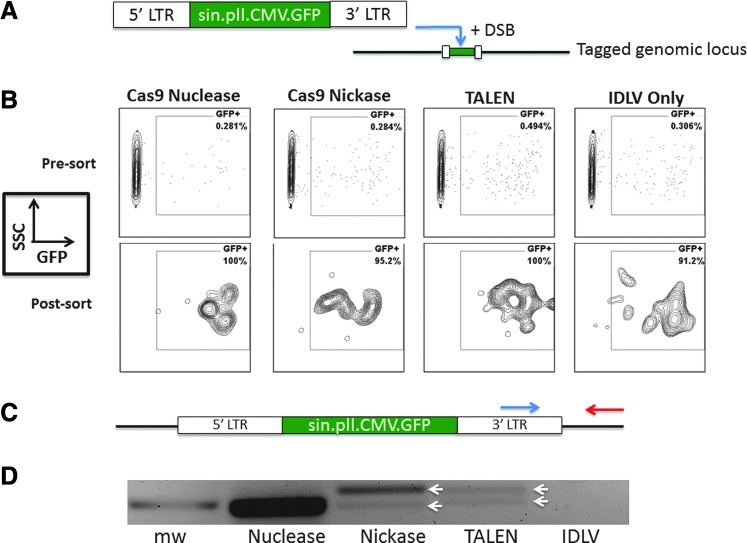
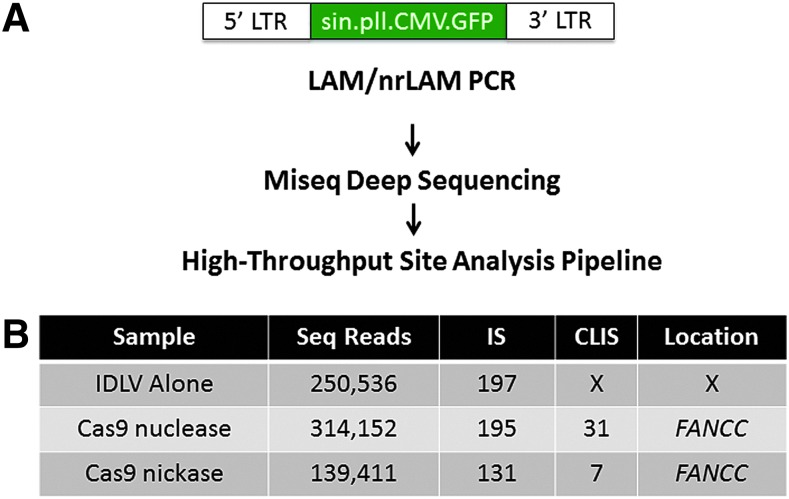
Genome engineering with designer nucleases is a rapidly progressing field, and the ability to correct human gene mutations in situ is highly desirable. We employed fibroblasts derived from a patient with Fanconi anemia as a model to test the ability of the clustered regularly interspaced short palindromic repeats/Cas9 nuclease system to mediate gene correction. We show that the Cas9 nuclease and nickase each resulted in gene correction, but the nickase, because of its ability to preferentially mediate homology-directed repair, resulted in a higher frequency of corrected clonal isolates. To assess the off-target effects, we used both a predictive software platform to identify intragenic sequences of homology as well as a genome-wide screen utilizing linear amplification-mediated PCR. We observed no off-target activity and show RNA-guided endonuclease candidate sites that do not possess low sequence complexity function in a highly specific manner. Collectively, we provide proof of principle for precision genome editing in Fanconi anemia, a DNA repair-deficient human disorder.


Figures

<b>FIG. 1.</b>
FIG. 1.
FANCC c.456+4A>T gene targeting. (A) The FANCC locus with the c.456+4A>T mutation shown at far right; base highlighted in red. The CRISPR gRNA recognition site is in bold and the PAM sequence in orange. (B) CRISPR architecture and FANCC gene target recognition. A gRNA chimeric RNA species has a gene-specific component (purple upper-case letters) that recognizes a 23 bp sequence in the FANCC gene (highlighted yellow sequence) with the 3′ terminal NGG protospacer; adjacent motif shown in red letters. The remainder of the gRNA (purple lower-case letters) are constant regions that contain secondary structure that interacts with the Streptococcus pyogenes Cas9 nuclease protein (blue circles). The Cas9 RuvC- and HNH-like domains mediate noncomplementary and complementary DNA strand cleavage. A D10A mutation in the RuvC domain converts the complex to a nickase. (C) DNA expression platforms. Cas9 nuclease or RuvC D10A nickase were expressed from a plasmid containing the CMV promoter and bovine growth hormone polyadenylation signal (pA). gRNA gene expression was mediated by the U6 polymerase III promoter and a transcriptional terminator (pT). (D) Nuclease activity assessment by the Surveyor assay. The FANCC locus in cells that received CRISPR/Cas9 nuclease or nickase with corresponding gRNA (target site shown as a green box), or a GFP-treated control group (labeled “C”), were amplified with primers (red arrows) yielding a 417 bp product. Nuclease- or nickase-generated insertions or deletions from NHEJ result in heteroduplex formation with unmodified amplicons that are cleaved by the mismatch-dependent Surveyor nuclease. For CRISPR/Cas9, these cleavage products are 228 and 189 bp. Surveyor analysis of 293T cells (E) or FA-C fibroblasts (F). Equivalent amounts of DNA were amplified using the primers in 1D and showed post-Surveyor fragmentation patterns consistent with CRISPR/Cas9 activity, with arrows indicating the cleavage bands. Data shown are representative gels of four experiments each. Gel exposure time for 293T cell Surveyor group was 750 msec and for FA-C cells was 1.5 sec. C, GFP-treated cells serving as the control; Mw, molecular weight standards; FA-C, Fanconi anemia complementation group C; GFP, green fluorescent protein; gRNA, guide RNA; NHEJ, nonhomologous end-joining; PAM, protospacer adjacent motif.
<b>FIG. 2.</b>
FIG. 2.
Traffic light reporter assessment of DNA repair fates. (A) Schematic of the TLR reporter. The FANCC CRISPR/Cas9 target sequence is contained within the dashed lines and was inserted into the GFP portion of the construct, resulting in an out-of-frame GFP. The +3 picornaviral 2A sequence allows the downstream nonfunctional +3 mCherry to escape degradation of the nonfunctional GFP. Following target site cleavage in the presence of an exogenous GFP donor (box labeled “dsGFP donor”) the GFP gene is repaired by HDR and expresses GFP (expression indicated by green box; inactive mCherry shown as gray box). DNA repair by NHEJ can result in a frameshift that restores the mCherry ORF, resulting in red fluorescence (indicated by red-filled mCherry box; gray indicates inactive GFP). (B–E) Representative FACs plot of 293T TLR cell line treatment with CRISPR/Cas9 nuclease and nickase. A stable 293T cell line with an integrated copy of the FANCC TLR construct was generated that, at its basal level, was GFP negative and expressed <0.5% mCherry (B). This low level of expression is because of integration errors. (C) Donor-only-treated cells showing no endogenous HDR. (D and E) FANCC-TLR-293T cell line transfected with the target gRNA, GFP donor, and the Cas9 nuclease (D) or nickase (E) with GFP (x-axis) and mCherry (y-axis) measured at 72 hr posttransfection. (F–H) Quantification and graphical representation of four different experiments and three different donor concentrations observed from FACs plots similar to those shown in (B–E). GFP data are plotted as green bars, and mCherry is plotted as red. The three different GFP donor concentrations (250, 500, and 1000 ng) are detailed. The basal level of mCherry from 2B was subtracted from all treatment groups. For the nuclease, p<0.05 for NHEJ (mCherry) vs. GFP (HDR). For the nickase, p<0.05 for GFP (HDR) vs. mCherry (NHEJ). (I) HDR ratio for nuclease and nickase. To determine the HDR ratio, the percentage of cells expressing GFP was divided by those expressing mCherry at each donor concentration. Mean±SD are graphed, and for nickase vs. nuclease at 250 ng of donor, p= 0.7, at 500 ng of donor p= 0.04, and at 1000 ng of donor p<0.001. TLR, traffic light reporter.
<b>FIG. 3.</b>
FIG. 3.
Off-target sequence analysis. (A) In silico off-target site acquisition. The CRISPR Design Tool identified five intragenic OT sites. Chromosomal location and gene name are shown with the FANCC target locus at top. Mismatches between FANCC target and OT sites are in red. (B) Surveyor nuclease assessment of OT sites. OT alleles for 293T cells treated with nuclease (“Nu”), nickase (“Ni”), or GFP (“G”) were amplified and assayed by the Surveyor procedure. Blue arrow indicates a cleavage product present in all three treatment groups, which indicates the presence of a natural polymorphism. At right in (A) is the % modification (“% Mod”) using the CRISPR nuclease (“nuc”) or nickase (“nick”) at each target site determined by Surveyor.
<b>FIG. 4.</b>
FIG. 4.
Integrase-deficient lentiviral gene tagging. (A) Diagram of self-inactivating integrase-deficient GFP lentiviral cassette with expression regulated by the CMV promoter (sin.pll.CMV.GFP). In the presence of the CRISPR/Cas9 reagent that generates DNA DSBs or nicks, a full copy of the viral cassette can be trapped at the on- or off-target break site where it remains permanently. (B) FACS analysis of IDLV treatment groups. Seven days post-IDLV treatment±concomitant nuclease and nickase delivery, the cells were assessed for GFP (labeled “7 days”). The sorted cell (“Post sort”) populations were analyzed 5 days after the initial sort. (C) PCR screen for IDLV at FANCC and OT sites. PCR assay using a 3′ LTR primer (blue arrow) and a FANCC or OT locus-specific primer (red arrow) was performed. (D) FANCC locus-specific IDLV integration was observed and white arrows show amplicons that were sequenced. DSB, double-stranded DNA break; IDLV, integrase-deficient lentiviral; LTR, long terminal repeat. Color images available online at www.liebertpub.com/hum
<b>FIG. 5.</b>
FIG. 5.
Unbiased genome-wide screen for OT loci. (A) Experimental workflow. Duplicate samples of 293T cells with integrated IDLV were subjected to nrLAM PCR and LAM PCR using MseI or MluCI enzymes and next-generation sequencing with Illumina MiSeq deep sequencing. The dataset was then refined using the High-Throughput Site Analysis Pipeline (HISAP). HISAP trims the sequence reads to remove vector and linker nucleotides in order to retain only the host genomic fragment amplicons. Redundant/identical sequences are consolidated and then mapped and annotated using the BLAT UCSC Genome Informatics database. The prevalence of CLIS in proximity to a locus is then assessed. (B) CLIS identification of IDLV integrants. The sample identifiers and number of sequence reads analyzed for each are indicated at left. The total number of IS for each sample is shown and the number of CLIS (X=no CLIS identified for IDLV-only treatment group) observed. For all of the reagents, the CLIS were localized only to the FANCC locus and were located within a 80 bp window. CLIS, clusters of integrations. Color images available online at www.liebertpub.com/hum
<b>FIG. 6.</b>
FIG. 6.
FANCC donor design and homology-directed repair. (A) The FANCC locus with the c.456+4A>T intronic mutation is indicated with a red arrow with asterisk. Blue arrows indicate the endogenous genomic primers used for HDR screening. (B) Gene correction donor. The donor is shown in alignment relative to the endogenous locus. The plasmid donor contains a 1.3 kb left arm of homology comprised of FANCC genomic sequences, silent mutations to prevent nuclease cutting of the donor, and the normalized base for the c.456+4A>T mutation (green line). Following this was a loxP-flanked PGK promoter-regulated puromycin-T2A-FANCC expression cassette and a right donor arm that is 0.8 kb in length. Blue arrows show the donor-specific PCR primers used for PCR analysis of CRISPR-treated, selected, and expanded clones. (C) Representative gel image of PCR screening approach for the left (“Lt”) and right (“Rt”) HDR using the donor-specific and locus-specific primers from (A) and (B). (D) Number of gene-corrected clones obtained. Numbers indicate the number of clonally expanded cells that showed a positive HDR PCR product. Two independent experiments were performed, and the data pooled together to obtain the total number of clones positive for HDR. (E) HDR-mediated c.456+4A>T mutation correction. Representative Sanger sequence data of the c.456+4A>T locus in untreated cells (top) and gene-corrected clones (bottom). Blue shading indicates the mutant thymine or corrected adenine base. Arrows on bottom sequence file show the donor-derived silent mutations present in the corrected clones.
<b>FIG. 7.</b>
FIG. 7.
CRISPR-mediated restoration of FANCC. (A) The FANCC locus with mutation is indicated with a red asterisk. The mutation results in aberrant splicing (red lines) that cause exon 4 (green box) skipping. Normal splicing is indicated by the green dashed lines. Tan box represents exon 3, green box is exon 4, purple box is exon 5, and orange box is exon 8. (B) FANCC transcripts. The c.456+4A>T mutation-induced exon skipping results in deletion of exon 4. Gene correction results in restoration of exon 4 in the transcript. The green arrow indicates an allele-specific primer for the silent base changes that were introduced by donor-derived HDR. The blue primer is an exon 8-specific primer. (C) Allele-specific PCR of nickase- and nuclease-corrected cell clones. A representative gel of an allele-specific PCR showing normalized transcripts in the nuclease and nickase clones. The specificity of the primer set is evident because of absence of amplification in FA-C (FC) or wild-type (WT) cells. To ensure that cDNA was amplification grade, samples were subjected to PCR with GAPDH primers (bottom). Mw, molecular weight standards. (D) Sanger sequencing of gene-modified allele. At left is the start of exon 4, with blue arrows indicating the silent polymorphisms that were incorporated into the genome-targeting donor. At right is the junction (shaded in blue) of the restored exon 4 contiguous with exon 5. (E) FANCC activity. Graph is a representation of four experiments of the nuclease and two nickase clones utilizing flow cytometric analysis of phosphorylated γ-H2AX in FA cells that are untreated or treated with 2 mM hydroxyurea. Nuclease or nickase clones were assessed simultaneously and data are presented as the mean fluorescence intensity (MFI) of the phospho-γ-H2AX antibody signal. FC cells (red bar) were stained with an isotype control. Mean±SD are graphed and * is gene-corrected clones vs. controls with p<0.05.

References

    1. Huard CC, Tremblay CS, Helsper K, et al. Fanconi anemia proteins interact with CtBP1 and modulate the expression of the Wnt antagonist Dickkopf-1. Blood 2013;121:1729–1739 - PubMed
    1. Whitney MA, Jakobs P, Kaback M, et al. The Ashkenazi Jewish Fanconi anemia mutation: incidence among patients and carrier frequency in the at-risk population. Hum Mutat 1994;3:339–341 - PubMed
    1. Whitney MA, Saito H, Jakobs PM, et al. A common mutation in the FACC gene causes Fanconi anaemia in Ashkenazi Jews. Nat Genet 1993;4:202–205 - PubMed
    1. Grompe M, D'Andrea A. Fanconi anemia and DNA repair. Hum Mol Genet 2001;10:2253–2259 - PubMed
    1. Pickering A, Zhang J, Panneerselvam J, Fei P. Advances in the understanding of Fanconi anemia tumor suppressor pathway. Cancer Biol Ther 2013;14:1089–1091 - PMC - PubMed

Publication types

MeSH terms