

Differential diagnosis of rSr' pattern in leads V1 -V2. Comprehensive review and proposed algorithm
- PMID: 25546557
- PMCID: PMC6931759
- DOI: 10.1111/anec.12241
Differential diagnosis of rSr' pattern in leads V1 -V2. Comprehensive review and proposed algorithm
Abstract
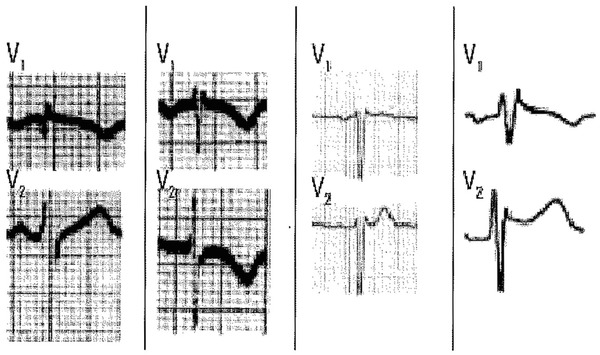
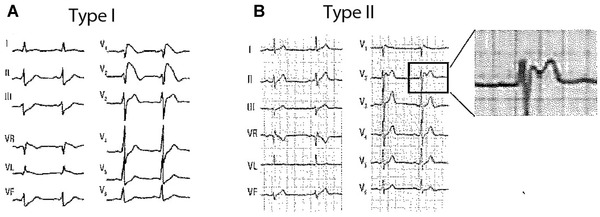
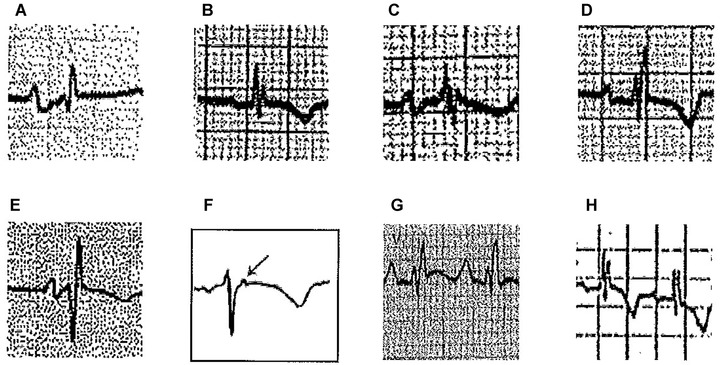
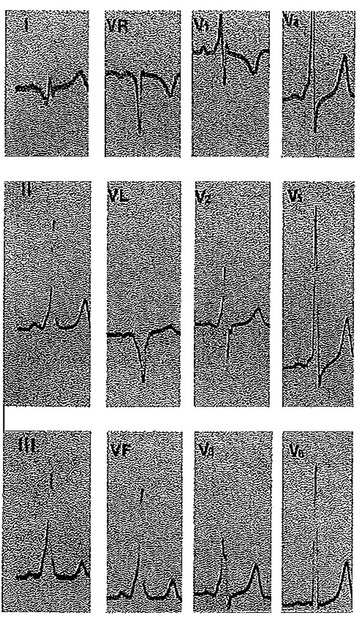
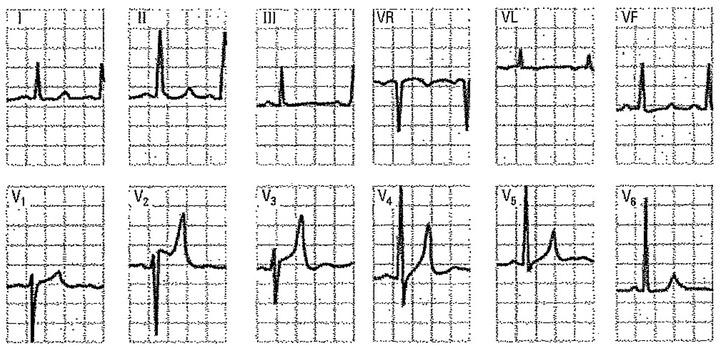
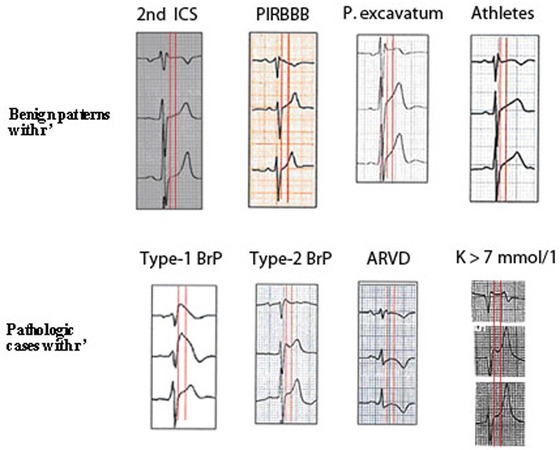
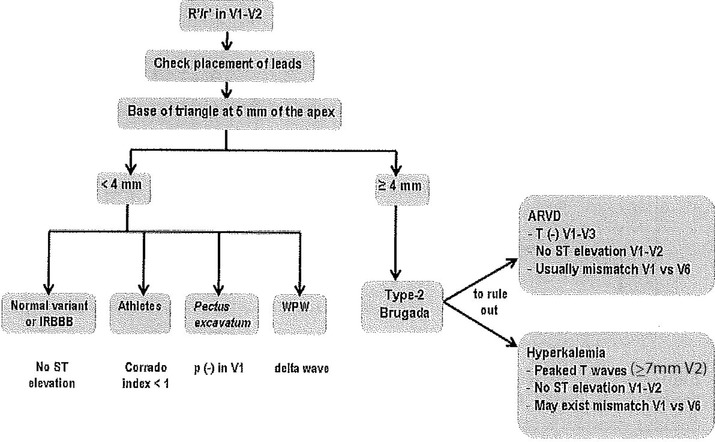
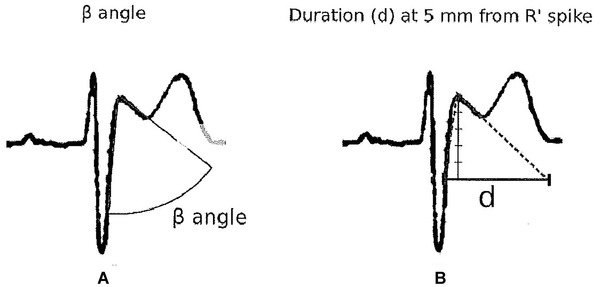
One of the more frequent dilemmas in ECG interpretation is the differential diagnosis of an rSr' pattern in leads V1 -V2 . We often face this finding in asymptomatic and otherwise healthy individuals and the causes may vary from benign nonpathological variants to severe or life-threatening heart diseases, such as Brugada syndrome or arrhythmogenic right ventricular dysplasia. In other cases, a normal variant of rSr' pattern can be misinterpreted as pathological after the occurrence of certain clinical events such as cardiac arrest or syncope of unknown cause. In this review we analyze in detail all the possible conditions, both benign and pathological that may explain the presence of this electrocardiographic pattern. We also propose a simple electrocardiographic algorithm for differential diagnosis.
Keywords: ARVD; Brugada ECG pattern; algorithm; rSr’ pattern.
© 2014 Wiley Periodicals, Inc.
Figures
Similar articles
-
A Practical Approach to the Investigation of an rSr' Pattern in Leads V1-V2.Can J Cardiol. 2015 Dec;31(12):1493-6. doi: 10.1016/j.cjca.2015.04.008. Epub 2015 Apr 18. Can J Cardiol. 2015. PMID: 26143139 Review.
-
Criteria for evaluating rSr' patterns due to high precordial ECG lead placement accurately confirm absence of a Brugada ECG pattern.J Electrocardiol. 2016 Mar-Apr;49(2):182-6. doi: 10.1016/j.jelectrocard.2015.12.015. Epub 2016 Jan 6. J Electrocardiol. 2016. PMID: 26850497
-
[Doubts of the cardiologist regarding an electrocardiogram presenting QRS V1-V2 complexes with positive terminal wave and ST segment elevation. Consensus Conference promoted by the Italian Cardiology Society].G Ital Cardiol (Rome). 2010 Nov;11(11 Suppl 2):3S-22S. G Ital Cardiol (Rome). 2010. PMID: 21361048 Italian.
-
Right ventricular electrocardiographic leads for detection of Brugada syndrome in sudden unexplained death syndrome survivors and their relatives.Clin Cardiol. 2001 Dec;24(12):776-81. doi: 10.1002/clc.4960241205. Clin Cardiol. 2001. PMID: 11768741 Free PMC article.
-
Defining electrocardiographic criteria to differentiate non-type 1 Brugada ECG variants from normal incomplete RBBB patterns in the young SCD-SOS cohort.J Cardiovasc Electrophysiol. 2022 Sep;33(9):2083-2091. doi: 10.1111/jce.15615. Epub 2022 Jul 16. J Cardiovasc Electrophysiol. 2022. PMID: 35771489 Review.
Cited by
-
Incomplete right bundle branch block: Challenges in electrocardiogram diagnosis.Anatol J Cardiol. 2021 Jun;25(6):380-384. doi: 10.5152/AnatolJCardiol.2021.84375. Anatol J Cardiol. 2021. PMID: 34100724 Free PMC article.
-
Long-term outcome of intraventricular conduction delays in the general population.Ann Noninvasive Electrocardiol. 2021 Jan;26(1):e12788. doi: 10.1111/anec.12788. Epub 2020 Aug 17. Ann Noninvasive Electrocardiol. 2021. PMID: 32804416 Free PMC article.
-
Electrocardiographic Predictors of Cardiovascular Mortality.Dis Markers. 2015;2015:727401. doi: 10.1155/2015/727401. Epub 2015 Jul 16. Dis Markers. 2015. PMID: 26257460 Free PMC article. Review.
-
Significant Delayed Activation on the Right Ventricular Outflow Tract Represents Complete Right Bundle-Branch Block Pattern in Brugada Syndrome.J Am Heart Assoc. 2023 May 16;12(10):e028706. doi: 10.1161/JAHA.122.028706. Epub 2023 May 9. J Am Heart Assoc. 2023. PMID: 37158059 Free PMC article.
-
Methods for Improving the Diagnosis of a Brugada ECG Pattern.Ann Noninvasive Electrocardiol. 2016 Mar;21(2):210-3. doi: 10.1111/anec.12317. Epub 2015 Nov 2. Ann Noninvasive Electrocardiol. 2016. PMID: 26524486 Free PMC article.
References
-
- Sodi Pallares D, Bisteni A, Medrano G. Electrocardiografia y Vectorcardiografia Deductiva. Mexico DF, Mexico: La Prensa Médica Mexicana, 1967.
-
- Durrer D, Van Dam R, Freud G, et al. Total excitation of the isolated human heart. Circulation 1970;41:899–912. - PubMed
-
- Bayes de Luna A. Textbook of Clinical ECG. Hoboken, NJ: Wiley‐Blackwell, 2012.
-
- Liao YL, Emidy LA, Dyer A, et al. Characteristics and prognosis of incomplete right bundle branch block: An epidemiologic study. J Am Coll Cardiol 1986;7(3):492–499. - PubMed
Publication types
MeSH terms
LinkOut - more resources
Full Text Sources
Other Literature Sources
Medical
