. 2015 Mar 15;21(6):1360-72.
doi: 10.1158/1078-0432.CCR-14-2146. Epub 2014 Dec 29.

Tyrosine kinase inhibition in leukemia induces an altered metabolic state sensitive to mitochondrial perturbations

Affiliations

Tyrosine kinase inhibition in leukemia induces an altered metabolic state sensitive to mitochondrial perturbations

Francesca Alvarez-Calderon et al. Clin Cancer Res. .

Abstract

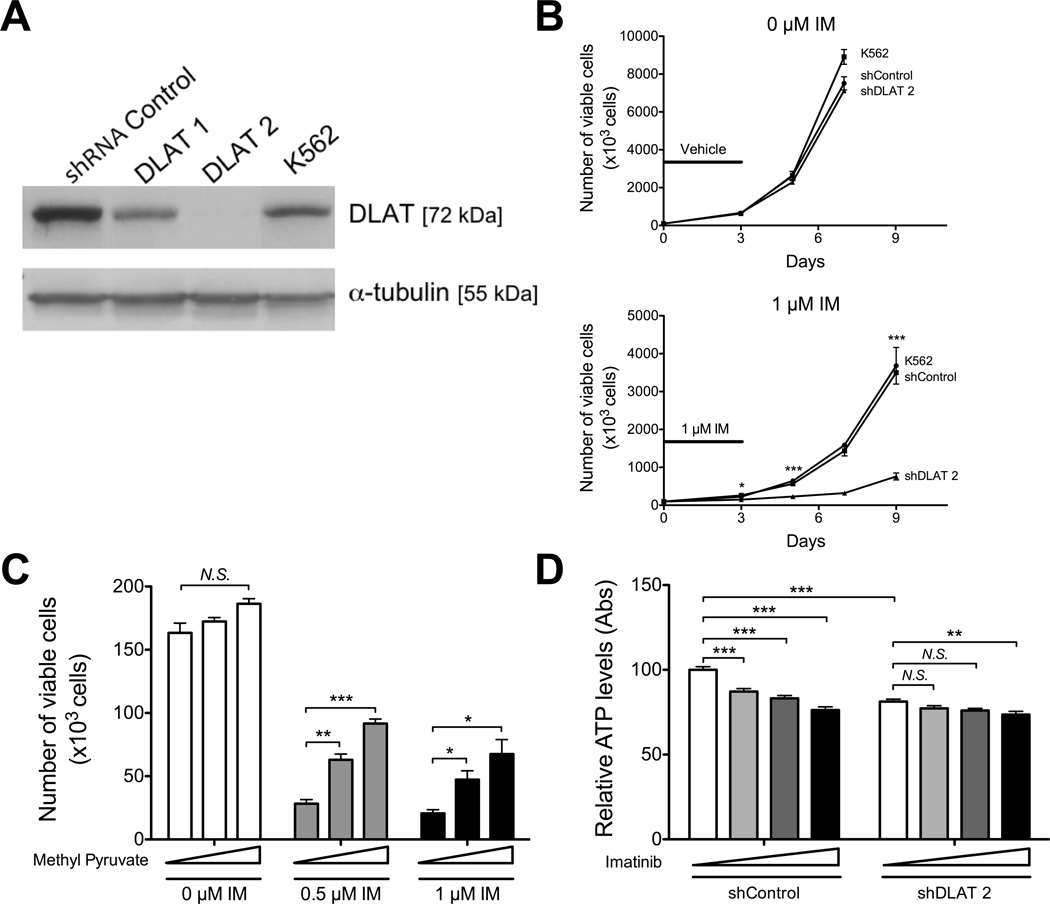
Purpose: Although tyrosine kinase inhibitors (TKI) can be effective therapies for leukemia, they fail to fully eliminate leukemic cells and achieve durable remissions for many patients with advanced BCR-ABL(+) leukemias or acute myelogenous leukemia (AML). Through a large-scale synthetic lethal RNAi screen, we identified pyruvate dehydrogenase, the limiting enzyme for pyruvate entry into the mitochondrial tricarboxylic acid cycle, as critical for the survival of chronic myelogenous leukemia (CML) cells upon BCR-ABL inhibition. Here, we examined the role of mitochondrial metabolism in the survival of Ph(+) leukemia and AML upon TK inhibition.

Experimental design: Ph(+) cancer cell lines, AML cell lines, leukemia xenografts, cord blood, and patient samples were examined.

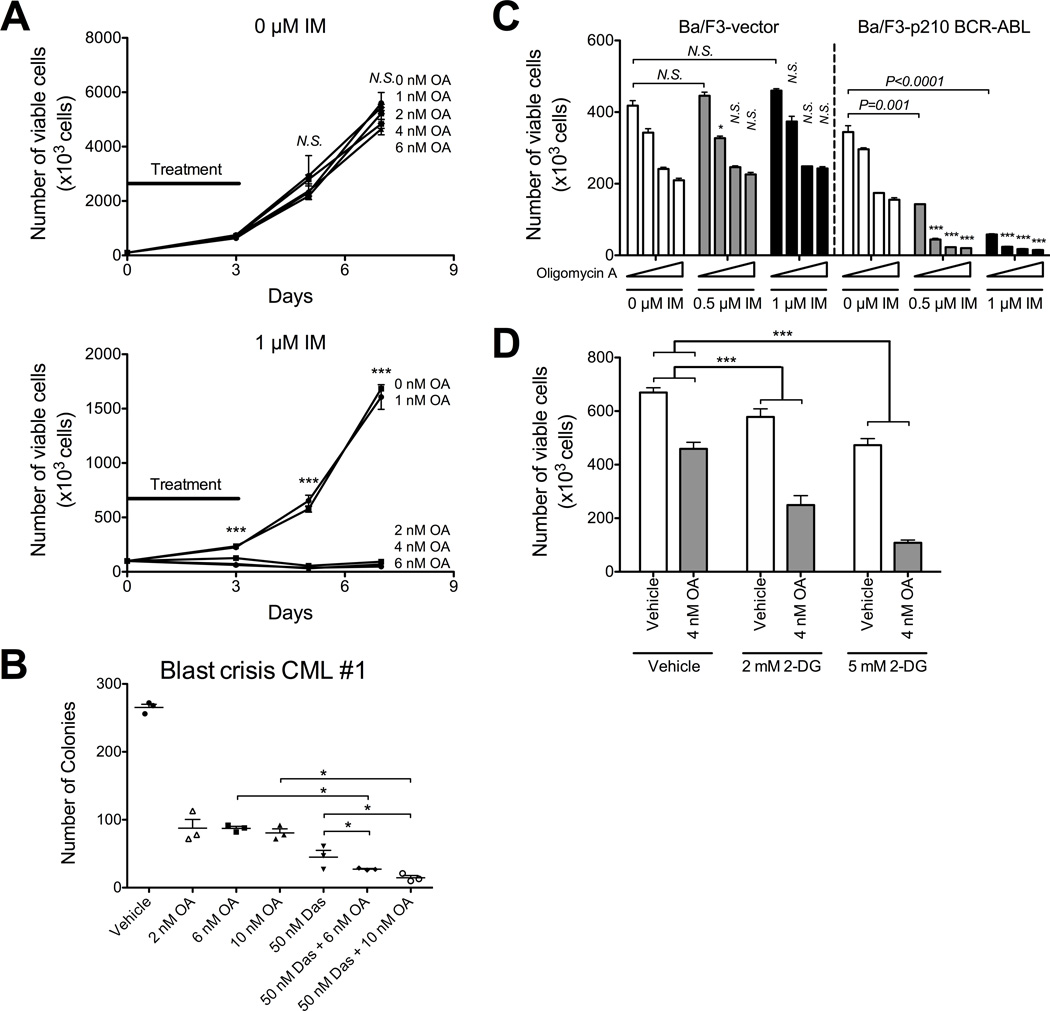
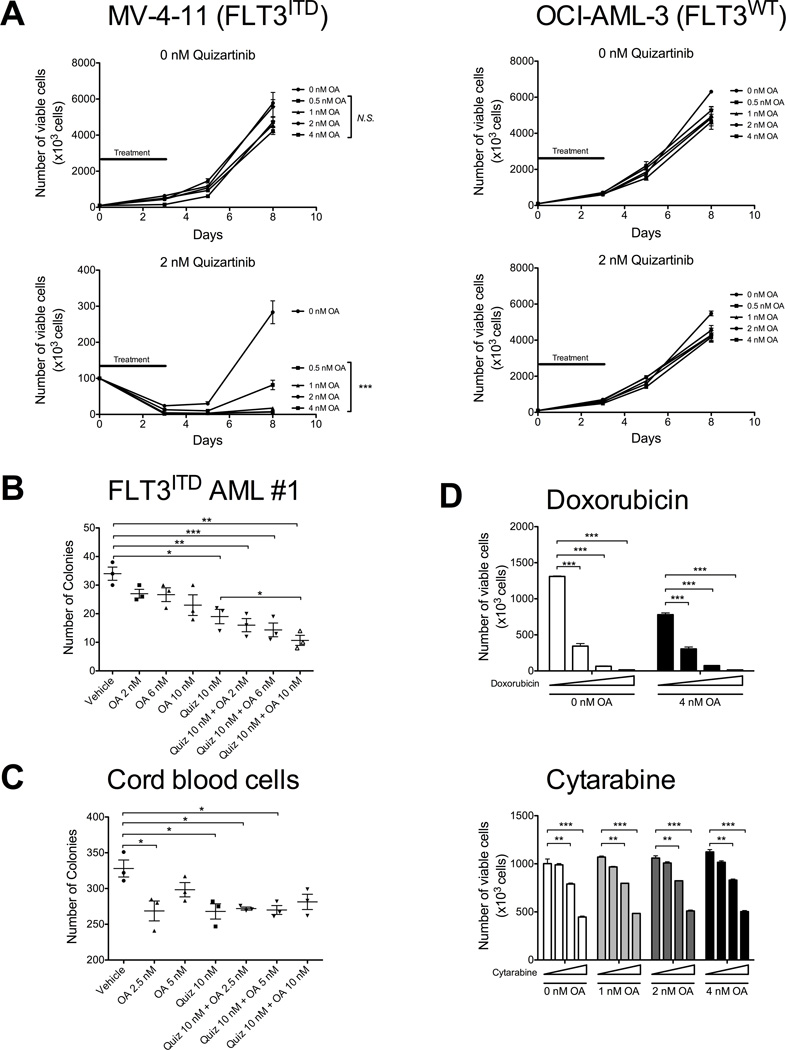
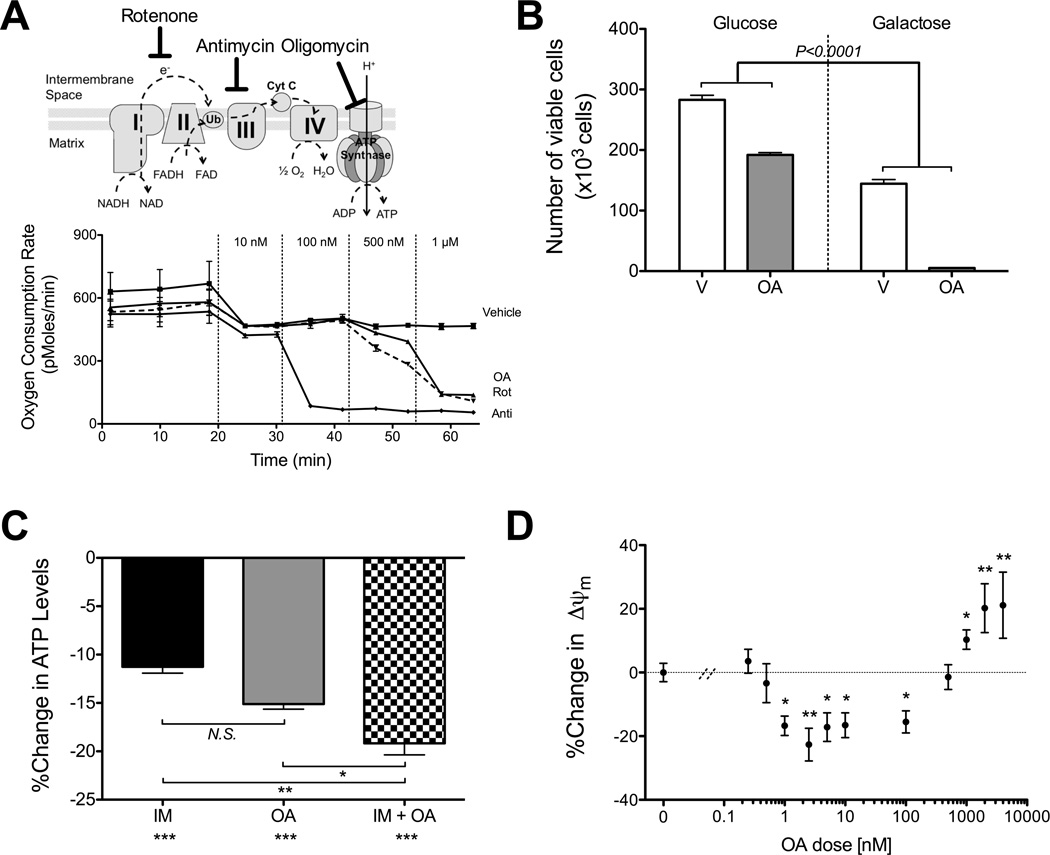
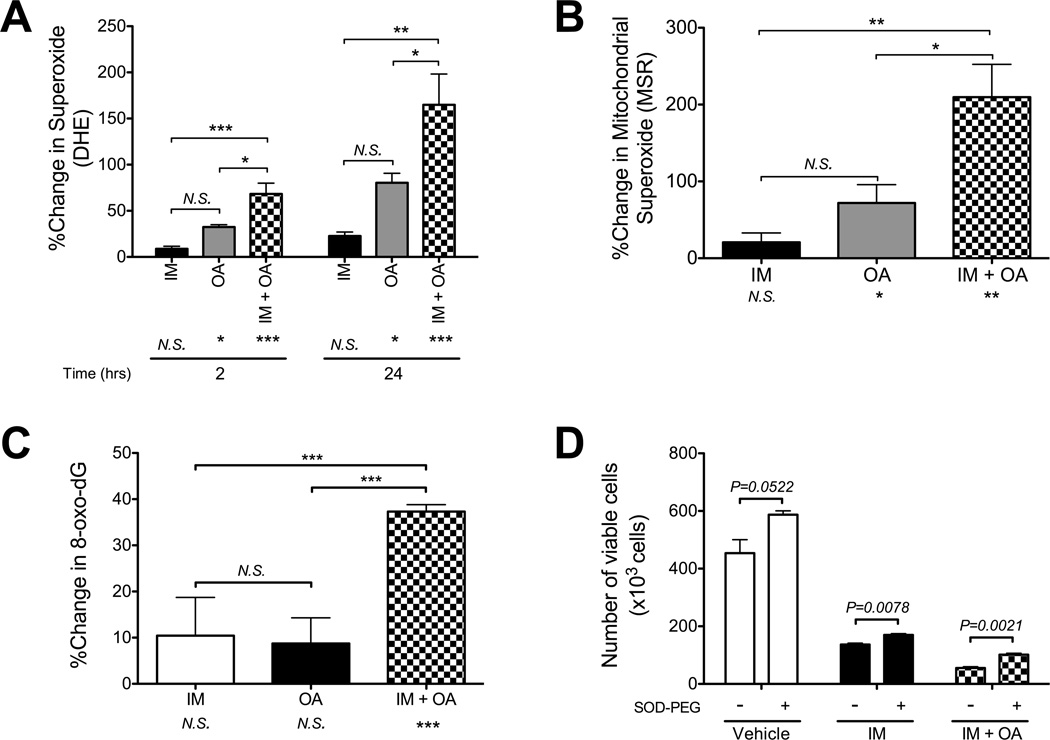
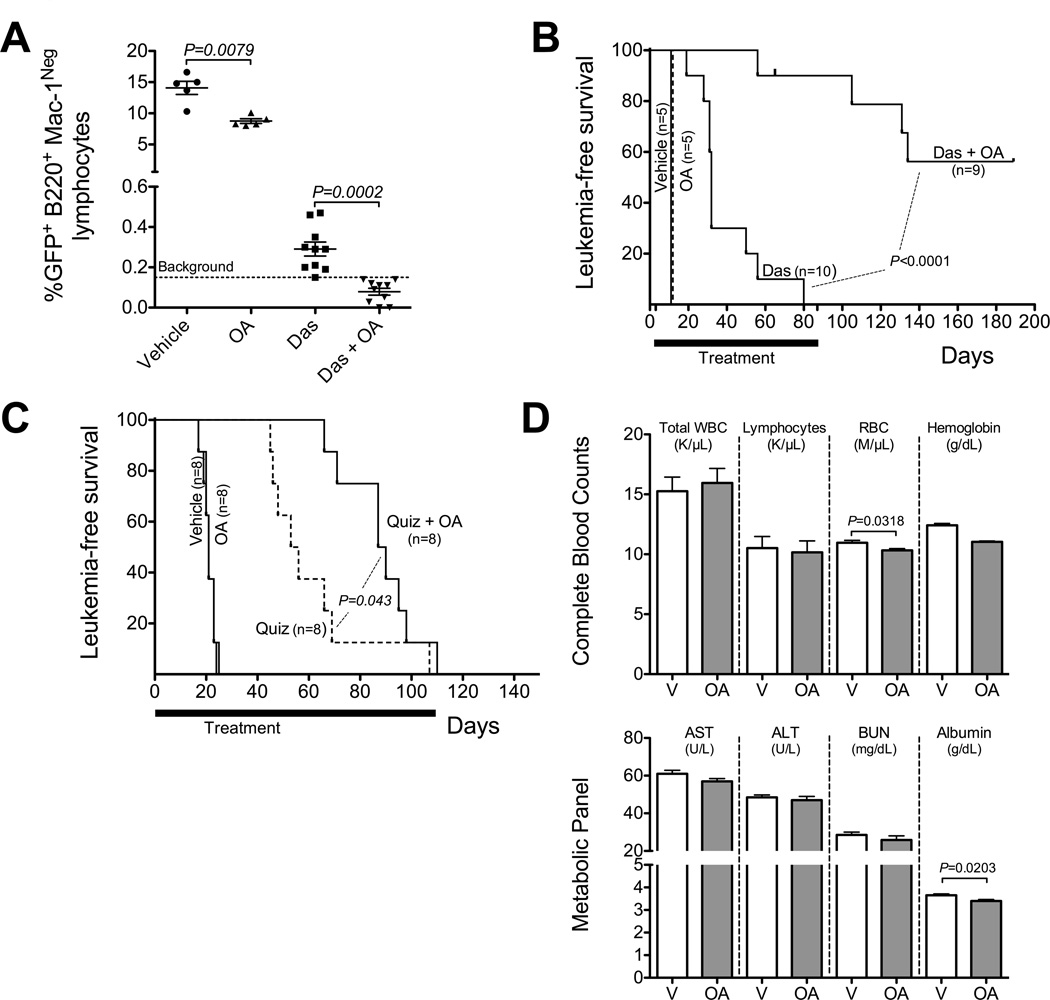
Results: We showed that the mitochondrial ATP-synthase inhibitor oligomycin-A greatly sensitized leukemia cells to TKI in vitro. Surprisingly, oligomycin-A sensitized leukemia cells to BCR-ABL inhibition at concentrations of 100- to 1,000-fold below those required for inhibition of respiration. Oligomycin-A treatment rapidly led to mitochondrial membrane depolarization and reduced ATP levels, and promoted superoxide production and leukemia cell apoptosis when combined with TKI. Importantly, oligomycin-A enhanced elimination of BCR-ABL(+) leukemia cells by TKI in a mouse model and in primary blast crisis CML samples. Moreover, oligomycin-A also greatly potentiated the elimination of FLT3-dependent AML cells when combined with an FLT3 TKI, both in vitro and in vivo.

Conclusions: TKI therapy in leukemia cells creates a novel metabolic state that is highly sensitive to particular mitochondrial perturbations. Targeting mitochondrial metabolism as an adjuvant therapy could therefore improve therapeutic responses to TKI for patients with BCR-ABL(+) and FLT3(ITD) leukemias.


Conflict of interest statement

Conflict of Interest: All authors declare that they have no conflict of interest relevant to this study.

Figures

Figure 1
Figure 1. Mitochondrial metabolism becomes essential in TKI-treated Ph+ leukemia cells
K562 cells were transduced with an shRNA targeting DLAT or non-targeting control and selected in puromycin. A. Expression of DLAT was assessed by Western blot probing for DLAT and α-tubulin. B. K562 parental and knockdown cell lines were treated with vehicle (top) or 1 µM imatinib (bottom) for 3 days, followed by replating the cells without drug to assess remaining proliferative potential. The black line indicates the duration of treatment. At the indicated time points, an aliquot was stained with PI and the number of viable cells determined by flow cytometry. Statistical comparison of shControl to shDLAT2 is shown. C. K562 cells were grown in medium supplemented with increasing concentrations of methyl-pyruvate (0, 5, 10 mM, indicated by triangle) for 3 days and the number of viable cells determined by flow cytometry. D. K562 parental and knockdown cell lines were treated with imatinib for 24 h (0, 1, 2, 5 µM, indicated by triangle) and assayed for ATP levels using the CellTiter-Glo assay and data were normalized to viable cell number. * indicates p<0.05, **p<0.01, and *** p<0.001.
Figure 2
Figure 2. Oligomycin-A sensitizes BCR-ABL+ leukemia cells to BCR-ABL inhibition
A. K562 cells were treated with the indicated concentrations of oligomycin-A (OA; 0, 1, 2, 4, 6 nM) in combination with vehicle (top) or 1 µM imatinib (bottom) for 3 days, followed by replating without drug. At the indicated time points, an aliquot was stained with PI and the number of viable cells determined by flow cytometry. The black lines indicate the duration of treatment. Statistical comparison of 0 nM to 2, 4 and 6 nM oligomycin-A at each imatinib concentration is shown over each bar and combination indices are shown in Table S2. B. A primary blast crisis CML sample was treated with oligomycin-A (2, 6 or 10 nM) alone or in combination with 50 nM dasatinib for 24 h, washed and seeded into 1.2% methylcellulose. Numbers of colonies were assessed after 14 days. C. Ba/F3 murine pro-B-cells expressing vector or BCR-ABL were treated with vehicle, 0.5 or 1 µM imatinib (IM), in combination with increasing concentrations of oligomycin-A (OA; 0, 1, 2, 4, 6 nM, indicated by triangle). After 3 days, the number of viable cells was determined by flow cytometry. Statistical pairwise comparisons of oligomycin-A-mediated changes are noted above each bar. D. K562 cells were treated with vehicle or 4 nM oligomycin-A and increasing concentration of 2-deoxyglucose (2-DG; 0, 2, 5 mM) for 3 days and viable cells counted by flow cytometry. *indicates p<0.05, **p<0.01, and ***p<0.001.
Figure 3
Figure 3. Oligomycin-A sensitizes acute myeloid leukemia cells to FLT3 inhibition
A. MV-4-11 cells (FLT3ITD, left) and OCI-AML-3 cells (FLT3WT, right) were treated with vehicle (top) or 2 nM quizartinib (bottom), in combination with increasing concentrations of oligomycin-A (OA; 0, 0.5, 1, 2, 4 nM) for 3 days, followed by replating the cells without drug. The black line indicates the duration of treatment. At the indicated time points, an aliquot was stained with PI and the number of viable cells determined by flow cytometry. Statistical comparison of 0 nM oligomycin-A to 0.5, 1, 2 and 4 nM oligomycin-A at each quizartinib concentration is shown next to the legend and combination indices are shown in Table S2. B–C. Cells from a patient with FLT3ITD AML (panel B) and human cord blood cells from a healthy newborn (panel C) were treated with vehicle or 10 nM quizartinib, in combination with increasing concentration of oligomycin-A (OA; 0, 2, 6, 10 nM) for 24 h, washed and seeded in methylcellulose. After 2 weeks, the number of colonies was counted using light microscopy. D. MOLM13 (FLT3ITD) were treated with increasing concentrations of doxorubicin (top; 0, 2.5, 5, 10 nM), or cytarabine (bottom; 0, 2.5, 5, 10 nM) in combination with oligomycin-A (0, 1, 2, 4 nM) for 3 days and the number of viable cells determined by flow cytometry. *indicates p<0.05, **p<0.01, and ***p<0.001.
Figure 4
Figure 4. Synergistic concentrations of oligomycin-A do not impair mitochondrial TCA cycle or respiration
A. The sites of action are depicted on the top panel. At the indicated time points, vehicle or increasing concentrations of oligomycin-A (OA), rotenone (Rot) or antimycin A (Anti) were sequentially added to K562 cells plated on Seahorse microplates and the oxygen consumption rate measured. The initial drop in OCR is due to equilibration of the probe after the addition of fresh media containing vehicle. B. K562 cells were treated with vehicle or 10 nM oligomycin-A for 24 h in media containing 20 mM of glucose or galactose and counted by flow cytometry. Statistical pairwise comparison of oligomycin-A mediated changes in cell numbers are shown.C. The relative ATP levels were measured and normalized to vehicle. K562 cells were treated for 1 h with 1 µM imatinib and/or 10 nM oligomycin-A. Statistical comparisons to vehicle are shown below x-axis labels. D. K562 cells were treated with increasing concentrations of oligomycin-A (0.25 nM to 4 µM) for 1 h and stained with Mitotracker Orange (MTO) to measure ΔΨm. Apoptotic cells were excluded by DAPI stain and mitochondrial mass measured with Mitotracker Green stain. The change relative to vehicle is shown.*indicates p<0.05, **p<0.01, and ***p<0.001.
Figure 5
Figure 5. Oligomycin-A increases levels of superoxide
A–B. K562 cells were treated with vehicle, 1 µM imatinib, 10 nM oligomycin-A or the combination of both drugs. After 2 or 24 h of treatment, cells were stained with DHE to measure total superoxide levels (A) or after 18 h with MitoSox-Red (MSR) to measure mitochondrial superoxide levels (B) using flow cytometry. Changes are normalized to vehicle control. Apoptotic cells were excluded by DAPI stain. C. After 48 h of treatment, cells were stained with avidin to measure the levels of 8-oxo-deoxyguanosine (normalized to vehicle control). For A, B and C, statistical comparisons to vehicle are shown below x-axis labels. D. K562 cells were treated with vehicle, 1 µM imatinib and/or 10 nM oligomycin-A for 3 days with vehicle or 200 U/mL of SOD-PEG. After 3 days, viable cell numbers were determined by flow cytometry. *indicates p<0.05, **p<0.01, and ***p<0.001.
Figure 6
Figure 6. Low concentration oligomycin-A synergizes with TKIs to eliminate leukemia cells in vivo
A–B. 5×10⁵Arf−/− BCR-ABL/GFP leukemia cells were injected i.v. into non-irradiated C57BL/6 mice. Mice were treated with either vehicle, oligomycin-A (OA; 100 µg/kg i.p.), dasatinib (Das; 10 mg/kg o.g.) or both drugs. Percent GFP in peripheral B-cells (B220+Mac1Neg) after 4 days of therapy was determined by flow cytometry (A). Kaplan-Meier survival curve for the indicated drug treatment is shown in B. The tick on the Das+OA curve at day 65 indicates a mouse that died with no signs of leukemia. C. NSG mice treated with busulfan and transplanted with 3×10⁶ cells. Mice were treated with either vehicle, oligomycin-A (OA; 100 µg/kg i.p,), quizartinib (Quiz; 10 mg/kg o.g.) or both drugs. Mice were monitored by peripheral bleed staining for human CD45 and HLA-ABC. Kaplan-Meier survival curve for the indicated drug treatment is shown in C. D. Mice were treated with either vehicle or oligomycin-A (OA; 100 µg/kg i.p.) daily for 15 days. Complete blood counts (top) and metabolic markers of renal and hepatic toxicities in serum (bottom) were analyzed on day 15.

References

    1. Deininger MW, Goldman JM, Melo JV. The molecular biology of chronic myeloid leukemia. Blood. 2000;96:3343–3356. - PubMed
    1. Faderl S, O'Brien S, Pui C-H, Stock W, Wetzler M, Hoelzer D, et al. Adult acute lymphoblastic leukemia: concepts and strategies. Cancer. 2010;116:1165–1176. - PMC - PubMed
    1. Foa R, Vitale A, Vignetti M, Meloni G, Guarini A, De Propris MS, et al. Dasatinib as first-line treatment for adult patients with Philadelphia chromosome-positive acute lymphoblastic leukemia. Blood. 2011;118:6521–6528. - PubMed
    1. Smith A, Howell D, Patmore R, Jack A, Roman E. Incidence of haematological malignancy by sub-type: a report from the Haematological Malignancy Research Network. British journal of cancer. 2011;105:1684–1692. - PMC - PubMed
    1. Santos FP, Jones D, Qiao W, Cortes JE, Ravandi F, Estey EE, et al. Prognostic value of FLT3 mutations among different cytogenetic subgroups in acute myeloid leukemia. Cancer. 2011;117:2145–2155. - PMC - PubMed

Publication types

MeSH terms