

Mammalian transcriptional hotspots are enriched for tissue specific enhancers near cell type specific highly expressed genes and are predicted to act as transcriptional activator hubs
- PMID: 25547756
- PMCID: PMC4302108
- DOI: 10.1186/s12859-014-0412-0
Mammalian transcriptional hotspots are enriched for tissue specific enhancers near cell type specific highly expressed genes and are predicted to act as transcriptional activator hubs
Abstract
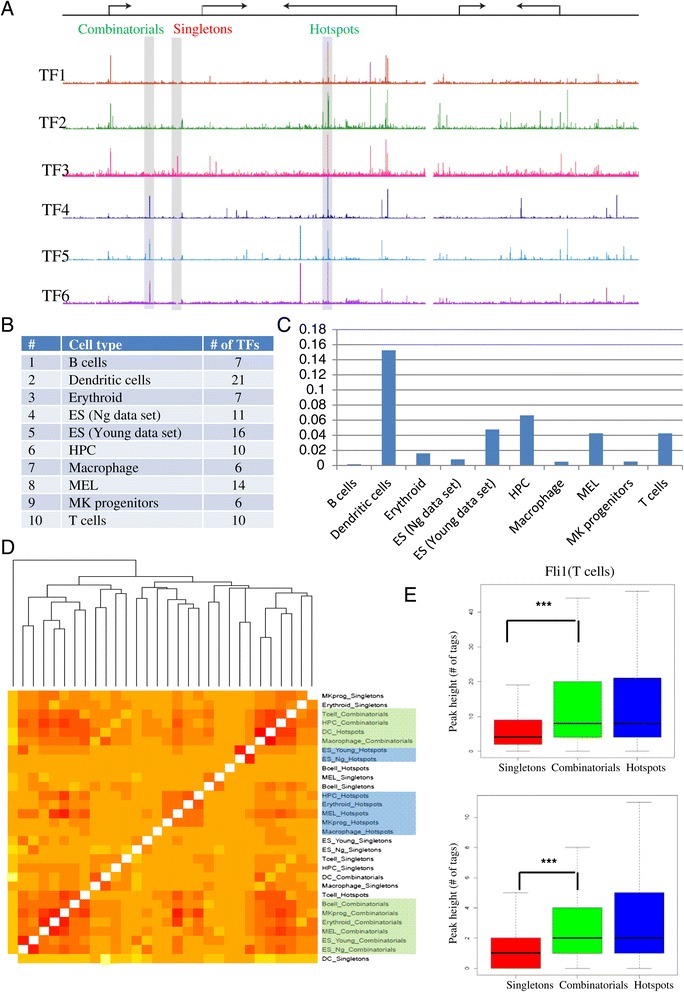
Background: Transcriptional hotspots are defined as genomic regions bound by multiple factors. They have been identified recently as cell type specific enhancers regulating developmentally essential genes in many species such as worm, fly and humans. The in-depth analysis of hotspots across multiple cell types in same species still remains to be explored and can bring new biological insights.
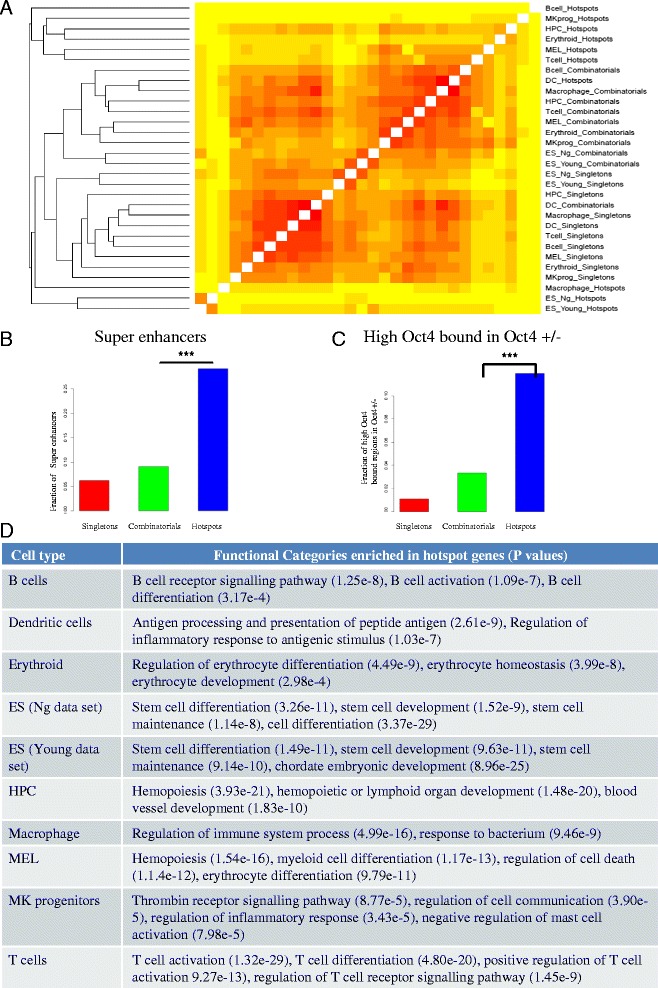
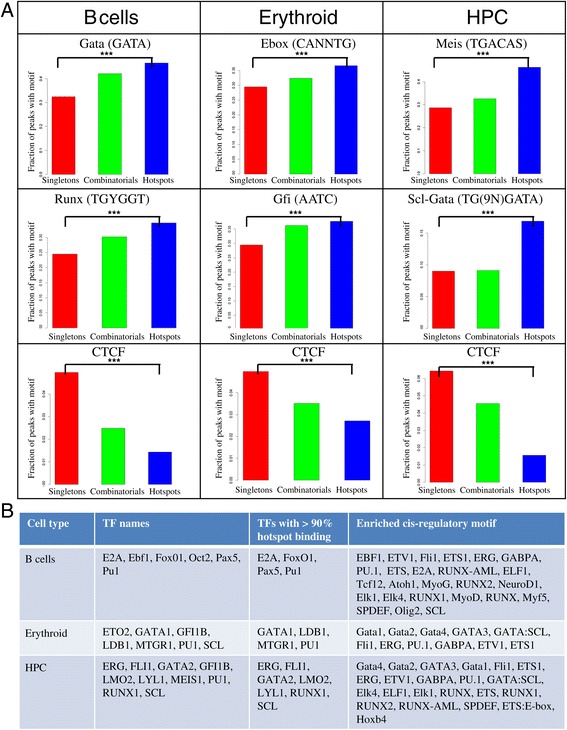
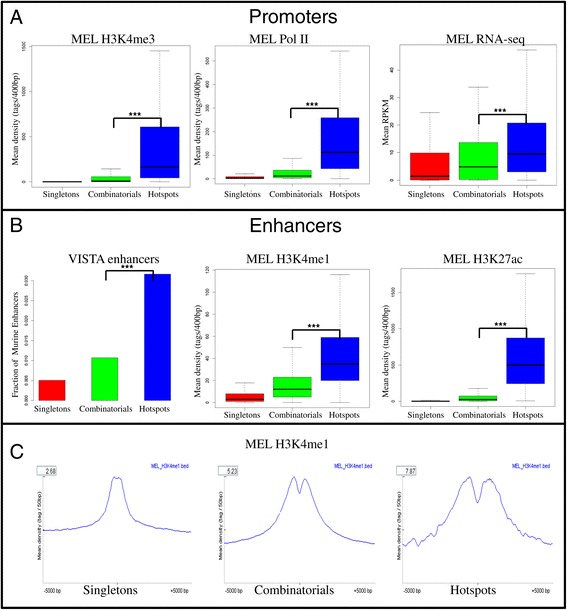
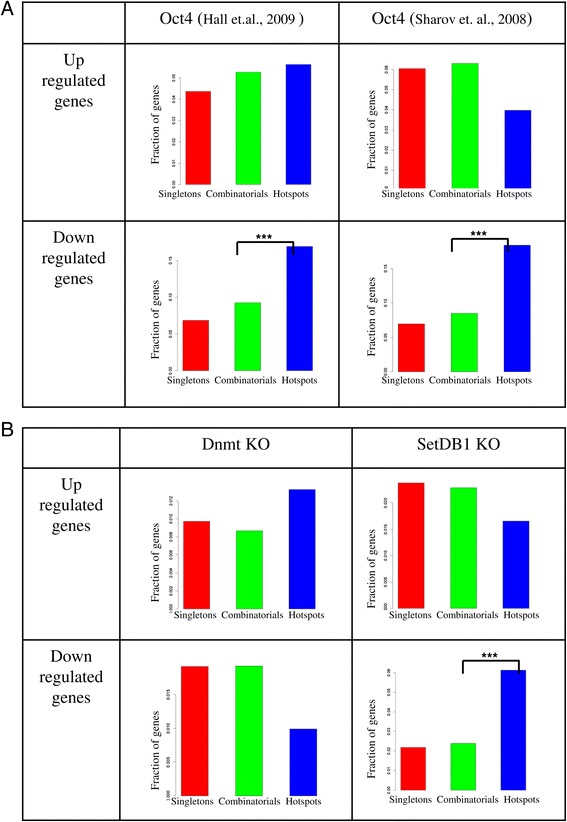
Results: We therefore collected 108 transcription-related factor (TF) ChIP sequencing data sets in ten murine cell types and classified the peaks in each cell type in three groups according to binding occupancy as singletons (low-occupancy), combinatorials (mid-occupancy) and hotspots (high-occupancy). The peaks in the three groups clustered largely according to the occupancy, suggesting priming of genomic loci for mid occupancy irrespective of cell type. We then characterized hotspots for diverse structural functional properties. The genes neighbouring hotspots had a small overlap with hotspot genes in other cell types and were highly enriched for cell type specific function. Hotspots were enriched for sequence motifs of key TFs in that cell type and more than 90% of hotspots were occupied by pioneering factors. Though we did not find any sequence signature in the three groups, the H3K4me1 binding profile had bimodal peaks at hotspots, distinguishing hotspots from mono-modal H3K4me1 singletons. In ES cells, differentially expressed genes after perturbation of activators were enriched for hotspot genes suggesting hotspots primarily act as transcriptional activator hubs. Finally, we proposed that ES hotspots might be under control of SetDB1 and not DNMT for silencing.
Conclusion: Transcriptional hotspots are enriched for tissue specific enhancers near cell type specific highly expressed genes. In ES cells, they are predicted to act as transcriptional activator hubs and might be under SetDB1 control for silencing.
Figures
References
-
- Wilson NK, Foster SD, Wang X, Knezevic K, Schütte J, Kaimakis P, Chilarska PM, Kinston S, Ouwehand WH, Dzierzak E, Pimanda JE, de Bruijn MFTR, Göttgens B. Combinatorial transcriptional control in blood stem/progenitor cells: genome-wide analysis of ten major transcriptional regulators. Cell Stem Cell. 2010;7:532–544. doi: 10.1016/j.stem.2010.07.016. - DOI - PubMed
-
- Moorman C, Sun LV, Wang J, de Wit E, Talhout W, Ward LD, Greil F, Lu X-J, White KP, Bussemaker HJ, van Steensel B. Hotspots of transcription factor colocalization in the genome of Drosophila melanogaster. Proceedings of the National Academy of Sciences. 2006;103:12027–12032. doi: 10.1073/pnas.0605003103. - DOI - PMC - PubMed
-
- Gerstein MB, Lu ZJ, Van Nostrand EL, Cheng C, Arshinoff BI, Liu T, Yip KY, Robilotto R, Rechtsteiner A, Ikegami K, Alves P, Chateigner A, Perry M, Morris M, Auerbach RK, Feng X, Leng J, Vielle A, Niu W, Rhrissorrakrai K, Agarwal A, Alexander RP, Barber G, Brdlik CM, Brennan J, Brouillet JJ, Carr A, Cheung M-S, Clawson H, Contrino S, et al. Integrative analysis of the Caenorhabditis elegans genome by the modENCODE project. Science. 2010;330:1775–1787. doi: 10.1126/science.1196914. - DOI - PMC - PubMed
-
- Yip KY, Cheng C, Bhardwaj N, Brown JB, Leng J, Kundaje A, Rozowsky J, Birney E, Bickel P, Snyder M, Gerstein M. Classification of human genomic regions based on experimentally determined binding sites of more than 100 transcription-related factors. Genome Biology. 2012;13:R48. doi: 10.1186/gb-2012-13-9-r48. - DOI - PMC - PubMed
Publication types
MeSH terms
Substances
Associated data
- Actions
- Actions
- Actions
- Actions
- Actions
- Actions
- Actions
- Actions
- Actions
- Actions
- Actions
- Actions
- Actions
- Actions
- Actions
Grants and funding
LinkOut - more resources
Full Text Sources
Other Literature Sources
Miscellaneous
