

Pathogenic potential, genetic diversity, and population structure of Escherichia coli strains isolated from a forest-dominated watershed (Comox Lake) in British Columbia, Canada
- PMID: 25548059
- PMCID: PMC4325175
- DOI: 10.1128/AEM.03738-14
Pathogenic potential, genetic diversity, and population structure of Escherichia coli strains isolated from a forest-dominated watershed (Comox Lake) in British Columbia, Canada
Erratum in
-
Erratum for Chandran and Mazumder, Pathogenic Potential, Genetic Diversity, and Population Structure of Escherichia coli Strains Isolated from a Forest-Dominated Watershed (Comox Lake) in British Columbia, Canada.Appl Environ Microbiol. 2016 Jan 7;82(2):767. doi: 10.1128/AEM.03528-15. Print 2016 Jan 15. Appl Environ Microbiol. 2016. PMID: 26744258 Free PMC article. No abstract available.
Abstract
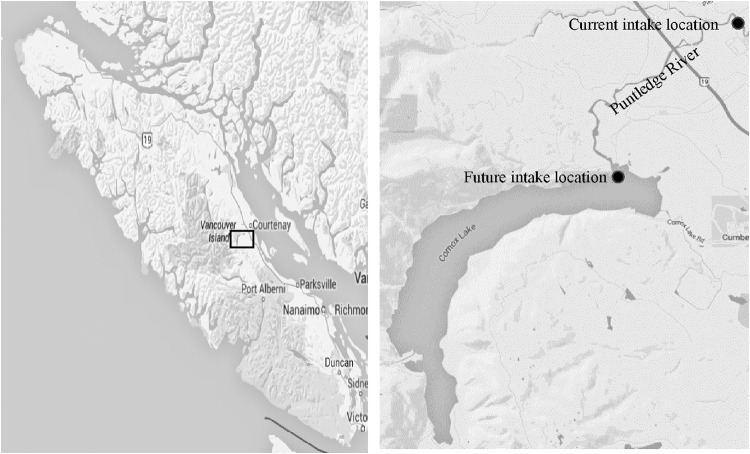
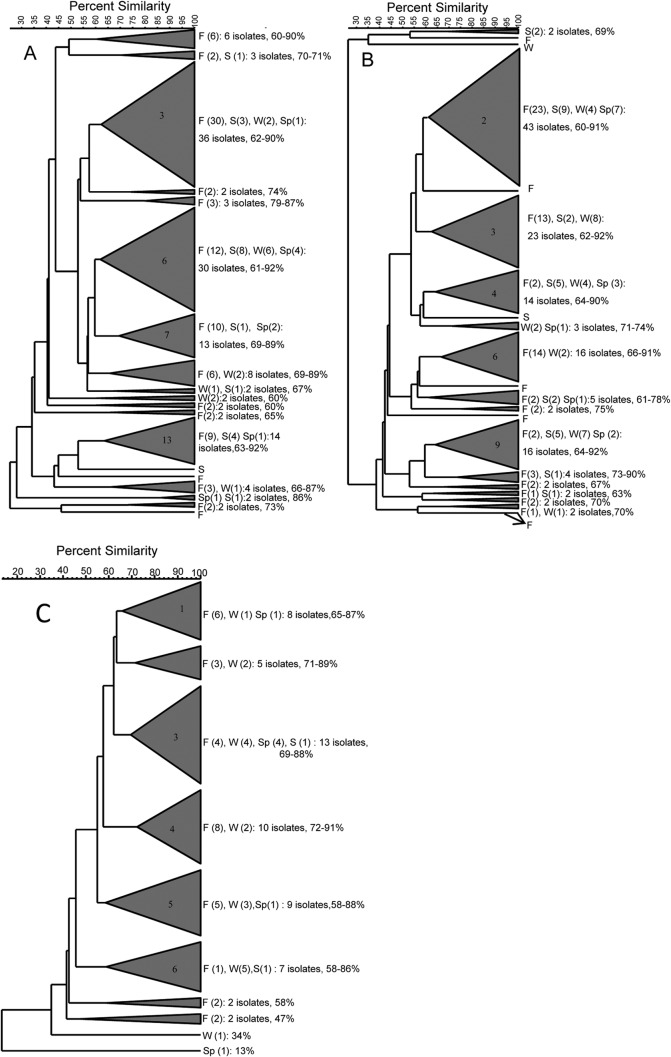
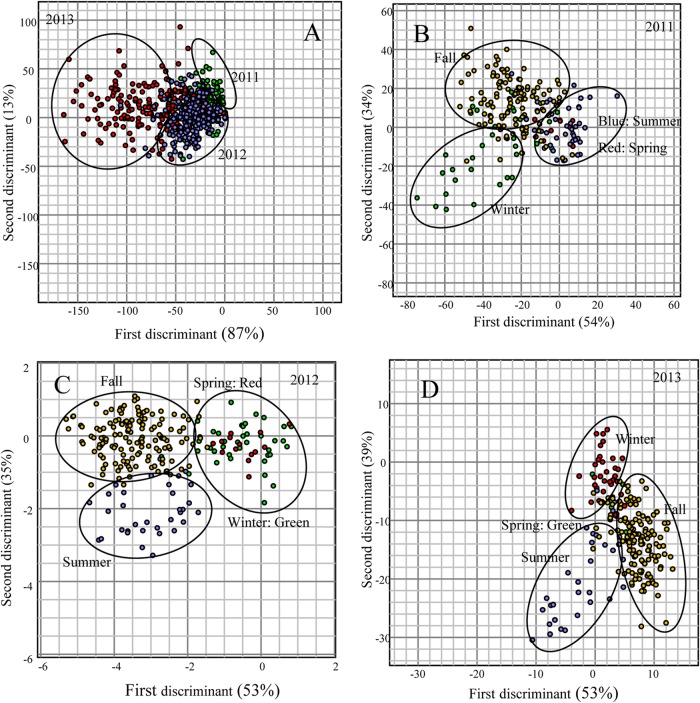
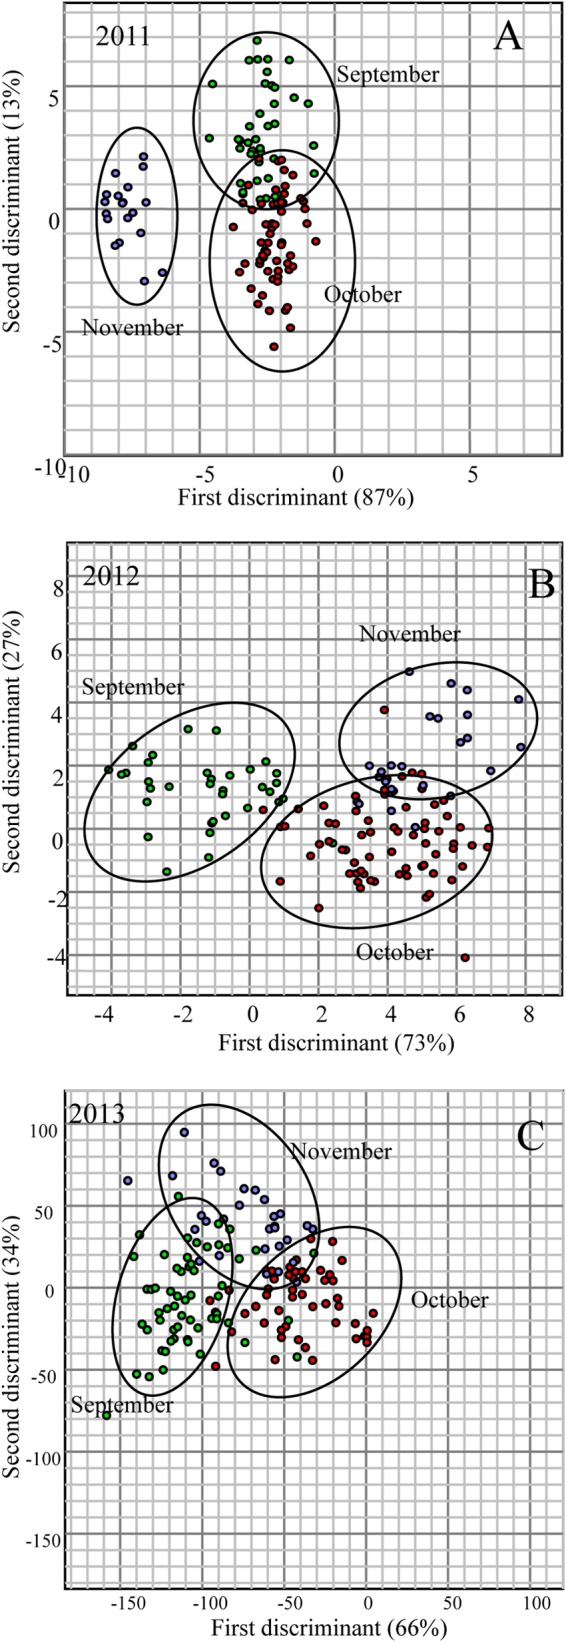
Escherichia coli isolates (n = 658) obtained from drinking water intakes of Comox Lake (2011 to 2013) were screened for the following virulence genes (VGs): stx1 and stx2 (Shiga toxin-producing E. coli [STEC]), eae and the adherence factor (EAF) gene (enteropathogenic E. coli [EPEC]), heat-stable (ST) enterotoxin (variants STh and STp) and heat-labile enterotoxin (LT) genes (enterotoxigenic E. coli [ETEC]), and ipaH (enteroinvasive E. coli [EIEC]). The only genes detected were eae and stx2, which were carried by 37.69% (n = 248) of the isolates. Only eae was harbored by 26.74% (n = 176) of the isolates, representing potential atypical EPEC strains, while only stx2 was detected in 10.33% (n = 68) of the isolates, indicating potential STEC strains. Moreover, four isolates were positive for both the stx2 and eae genes, representing potential EHEC strains. The prevalence of VGs (eae or stx2) was significantly (P < 0.0001) higher in the fall season, and multiple genes (eae plus stx2) were detected only in fall. Repetitive element palindromic PCR (rep-PCR) fingerprint analysis of 658 E. coli isolates identified 335 unique fingerprints, with an overall Shannon diversity (H') index of 3.653. Diversity varied among seasons over the years, with relatively higher diversity during fall. Multivariate analysis of variance (MANOVA) revealed that the majority of the fingerprints showed a tendency to cluster according to year, season, and month. Taken together, the results indicated that the diversity and population structure of E. coli fluctuate on a temporal scale, reflecting the presence of diverse host sources and their behavior over time in the watershed. Furthermore, the occurrence of potentially pathogenic E. coli strains in the drinking water intakes highlights the risk to human health associated with direct and indirect consumption of untreated surface water.
Copyright © 2015, American Society for Microbiology. All Rights Reserved.
Figures
References
-
- WHO. 2004. Guidelines for drinking-water quality. World Health Organization, Geneva, Switzerland.
-
- Mott J, Smith A. 2011. Library-dependent source tracking methods, p 31–59. In Hagedorn C, Blanch AR, Harwood VJ (ed), Microbial source tracking: methods, applications, and case studies. Springer Publishing Co, London, England.
Publication types
MeSH terms
Substances
LinkOut - more resources
Full Text Sources
Other Literature Sources
Molecular Biology Databases
