. 2015 Jan 13;112(2):436-41.
doi: 10.1073/pnas.1407302112. Epub 2014 Dec 29.

Effect of increasing CO2 on the terrestrial carbon cycle

Affiliations

Effect of increasing CO2 on the terrestrial carbon cycle

David Schimel et al. Proc Natl Acad Sci U S A. .

Abstract

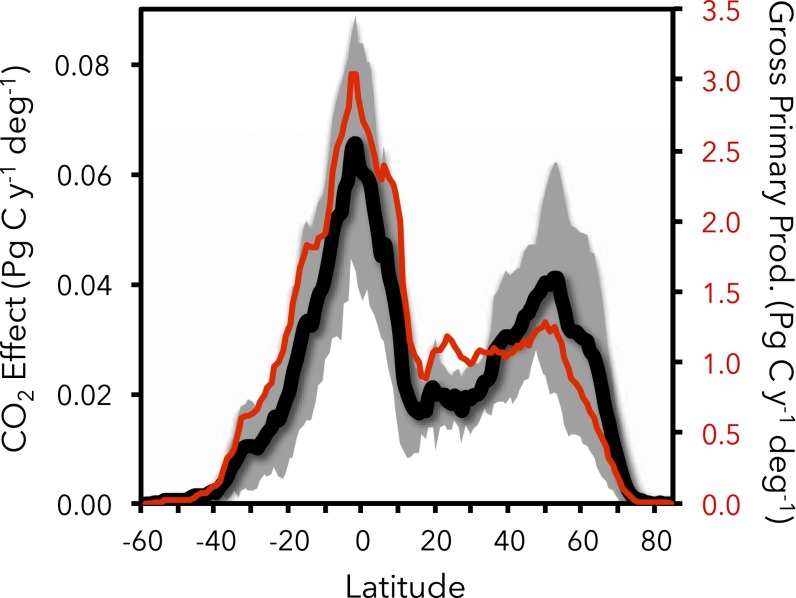
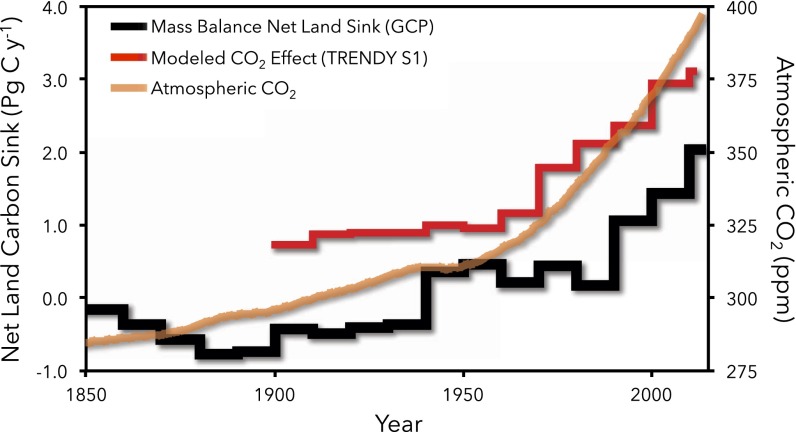
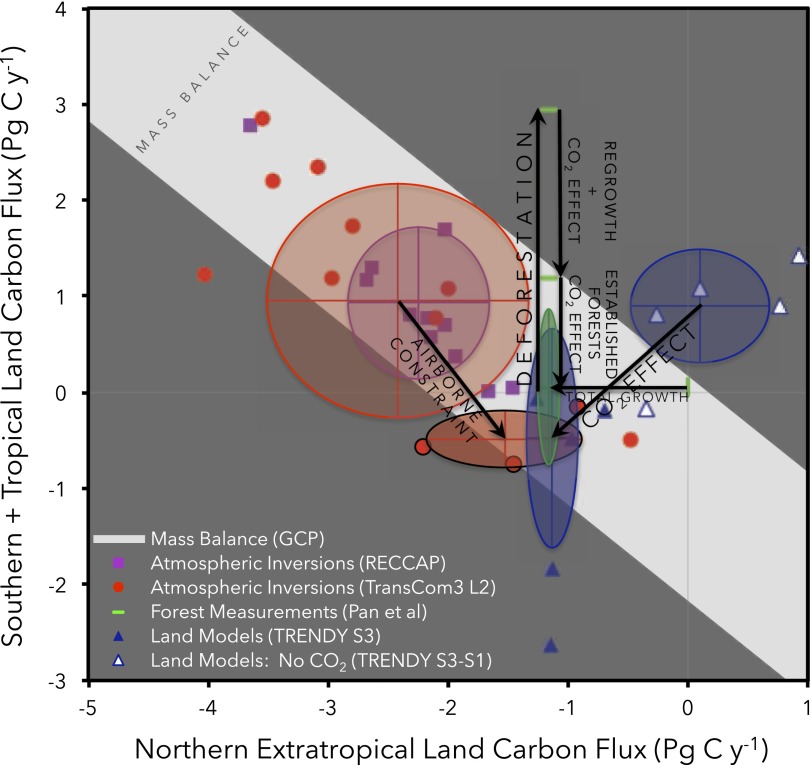
Feedbacks from the terrestrial carbon cycle significantly affect future climate change. The CO2 concentration dependence of global terrestrial carbon storage is one of the largest and most uncertain feedbacks. Theory predicts the CO2 effect should have a tropical maximum, but a large terrestrial sink has been contradicted by analyses of atmospheric CO2 that do not show large tropical uptake. Our results, however, show significant tropical uptake and, combining tropical and extratropical fluxes, suggest that up to 60% of the present-day terrestrial sink is caused by increasing atmospheric CO2. This conclusion is consistent with a validated subset of atmospheric analyses, but uncertainty remains. Improved model diagnostics and new space-based observations can reduce the uncertainty of tropical and temperate zone carbon flux estimates. This analysis supports a significant feedback to future atmospheric CO2 concentrations from carbon uptake in terrestrial ecosystems caused by rising atmospheric CO2 concentrations. This feedback will have substantial tropical contributions, but the magnitude of future carbon uptake by tropical forests also depends on how they respond to climate change and requires their protection from deforestation.

Keywords: atmospheric transport; carbon budget; climate feedback; tropics.


Conflict of interest statement

The authors declare no conflict of interest.

Figures

Fig. 1.
Fig. 1.
Zonal sums of the CO2 effect and gross primary productivity averaged over 2000–2010 from nine terrestrial biosphere models (see SI Text). The gray shaded area shows the multimodel SD around the multimodel mean CO2 effect (thick black line). The red line shows the multimodel mean GPP, illustrating the strong correlation between GPP and enhanced storage (net biome production) due to CO2 (the CO2 effect); the sign convention is reversed here for clarity (normally, uptake is negative).
Fig. 2.
Fig. 2.
Similarities in trend between atmospheric CO2 concentration changes (orange), the net terrestrial sink from the Global Carbon Project (black), and the modeled CO2 effect on net biome production from TRENDY (red) suggest that ecosystem responses to CO2 have played a role in increasing land carbon uptake over the last 150 y. The TRENDY and GCP data were averaged to 10-y intervals. Sign convention as in Fig. 1.
Fig. 3.
Fig. 3.
Comparison of independent carbon flux estimates. Atmospheric inverse results from the T3L2 and RECCAP intercomparison experiments show that across models, northern extratropical and tropical+southern fluxes are anticorrelated (since the models are also constrained by the atmospheric growth rate and tight fossil fuel and ocean flux estimates). The light gray region shows the corresponding constraints from GCP for 1992–2004, with the upper edge corresponding to the GCP estimate for the RECCAP period (2001−2004), +0.9 Pg C⋅y−1 uncertainty, and the lower edge corresponding to the GCP estimate for the T3L2 period (1992−1996), −0.9 Pg C⋅y−1 uncertainty. Although GCP shows a long-term increasing terrestrial sink (Fig. 2), shorter-term fluctuations result in the average sink for 1992–1996 being larger than for 2001–2004 (27). The upper red circle shows the mean and SD of the T3L2 results as reported by Gurney et al. (16), while the lower shows the mean and SD of the three models selected by the additional vertical gradient constraint in Stephens et al. (20). The green ellipse shows the estimates and uncertainty ranges from the Pan et al. (35) global forest inventory-based study for the period 1990–2007. The upward black vector shows the gross deforestation flux from Pan et al. (35), reduced, first, by regrowth (upper downward vector) and then by fluxes in intact forests (lower downward vector, potentially CO2 effect fluxes). Pan et al. (35) do not partition northern land components but estimate a net flux there of −1.1 Pg C⋅y−1, which is indicated by the horizontal black vector. The vertical vectors have been spread slightly for clarity. The solid blue triangles show process model estimates for the period 1990–2007 (TRENDY: see SI Text) including the simulated CO2 effect, climate effect, and land use fluxes. The open blue triangles show the same models excluding the CO2 effect flux. Blue ellipses show median and uncertainty with and without the CO2 effect, and the diagonal vector shows the additional impact of including CO2 effects T3L2, RECCAP, and TRENDY results are all presented here partitioned by the TransCom/RECCAP regions (see SI Text).

References

    1. Bodman RW, et al. Uncertainty in temperature projections reduced using carbon cycle and climate observations. Nat Clim Change. 2013;3:725–729.
    1. Friedlingstein P, et al. Climate–carbon cycle feedback analysis: Results from the C4MIP model intercomparison. J Clim. 2006;19:3337–3353.
    1. Keeling CD. The carbon dioxide cycle: Reservoir models to depict the exchange of atmospheric carbon dioxide with the oceans and land plants. In: Rasool SI, editor. Chemistry of the Lower Atmosphere. Plenum Press; New York: 1973. pp. 251–329.
    1. Gregory JM, Jones CD, Cadule P, Friedlingstein P. Quantifying carbon cycle feedbacks. J Clim. 2009;22:5232–5250.
    1. Friend AD, et al. Carbon residence time dominates uncertainty in terrestrial vegetation responses to future climate and atmospheric CO2. Proc Natl Acad Sci USA. 2014;111(9):3280–3285. - PMC - PubMed

Publication types