. 2015 Jan 13;112(2):406-11.
doi: 10.1073/pnas.1421138111. Epub 2014 Dec 29.

Bacterial growth laws reflect the evolutionary importance of energy efficiency

Affiliations

Bacterial growth laws reflect the evolutionary importance of energy efficiency

Arijit Maitra et al. Proc Natl Acad Sci U S A. .

Abstract

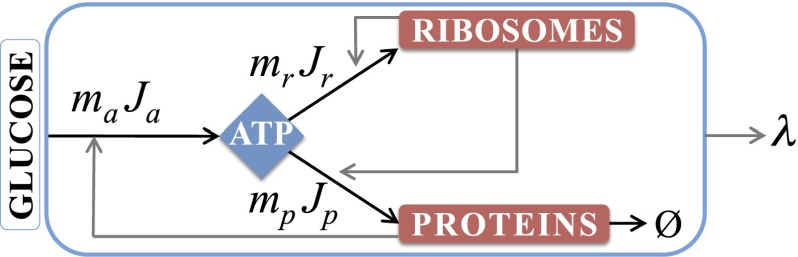
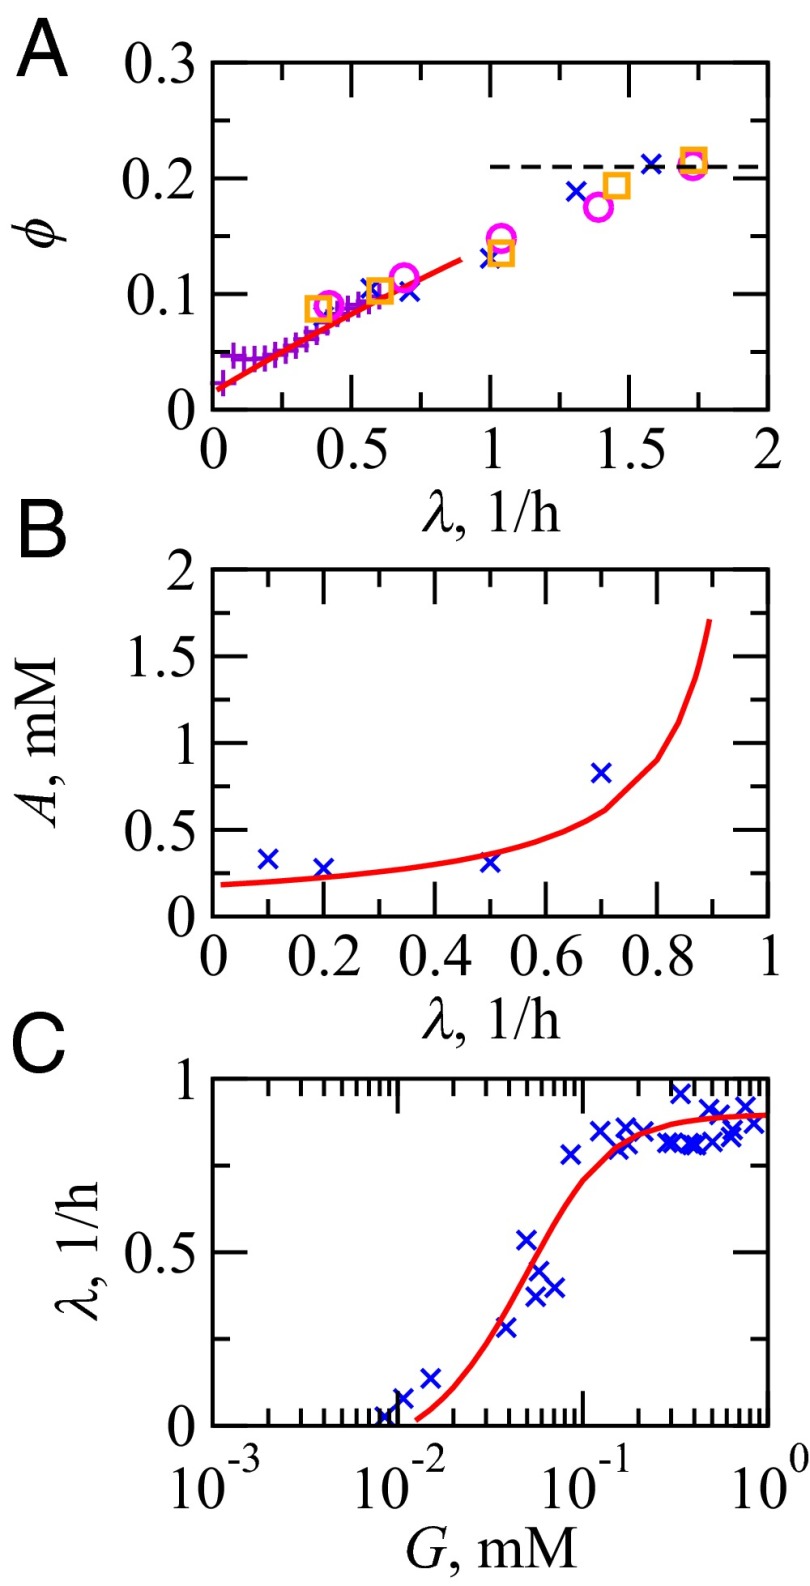
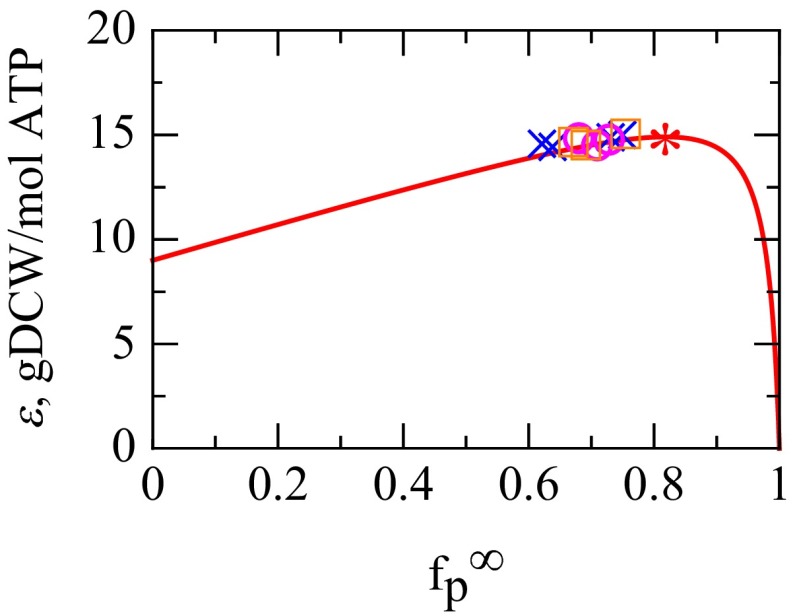
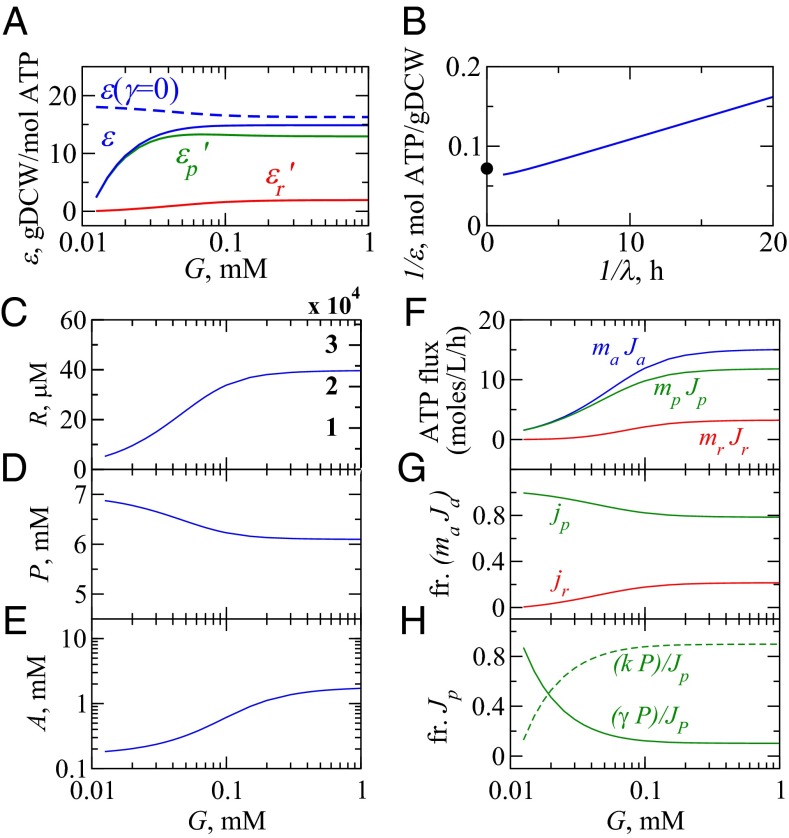
We are interested in the balance of energy and protein synthesis in bacterial growth. How has evolution optimized this balance? We describe an analytical model that leverages extensive literature data on growth laws to infer the underlying fitness landscape and to draw inferences about what evolution has optimized in Escherichia coli. Is E. coli optimized for growth speed, energy efficiency, or some other property? Experimental data show that at its replication speed limit, E. coli produces about four mass equivalents of nonribosomal proteins for every mass equivalent of ribosomes. This ratio can be explained if the cell's fitness function is the the energy efficiency of cells under fast growth conditions, indicating a tradeoff between the high energy costs of ribosomes under fast growth and the high energy costs of turning over nonribosomal proteins under slow growth. This model gives insight into some of the complex nonlinear relationships between energy utilization and ribosomal and nonribosomal production as a function of cell growth conditions.

Keywords: bacterial metabolism; energy efficiency; fitness landscape; growth laws; yield.


Conflict of interest statement

The authors declare no conflict of interest.

Figures

Fig. 1.
Fig. 1.
Minimal model of E. coli. Extracellular sugar is converted to ATP, which powers a two-compartment proteome: RPs and NRPs. In turn, the proteome catalyzes the energy-conversion process and growth of the cell. The black arrows show the ATP fluxes: maJa is the influx of sugar conversion to ATP, mrJr is the flow of ATP to produce ribosomes, mpJp is the flow of ATP to produce NRPs, indicates the degradation of NRPs, and λ is the specific growth rate of E. coli.
Fig. 2.
Fig. 2.
Comparison of model results (—) vs. experiments (symbols) at 37 °C. (A) The RP as a fraction of total protein weight in E. coli: °, Bremer and Dennis (6); ×, Scott et al. (10); and □ Forchhammer et al. (44). To get ϕ, the (rRNA/protein) ratio from ref. is scaled by a factor of 0.46 (6). +, fraction of ribosomal promoter activities of Zaslaver et al. (33) uniformly scaled to align with (°, ×, □). At fast growth, ϕ reaches a limit of 0.21 (- - -). (B) ATP concentration, A, in E. coli K-12 strain vs. specific growth rates of cells: ×, Ishii et al. (45). (C) E. coli specific growth rate vs. extracellular glucose concentration: ×, Monod (1).
Fig. 3.
Fig. 3.
The fitness landscape of energy efficiency ε vs. fp—the fractional amount of ribosomes translating NRPs at fast growth. The solid line is Eq. S18, grams of cell dry weight (gDCW) per mole of ATP, with machine constants kp , kr, and (γ/εrp) from Table 1. * Predicted maximum. The symbols ○, ×, and □ show values of fp (same as Fig. S2A) from experiments across all nutrients and growth rates λ0.7 1/h obtained from Eq. 16 with γ = 0.1 h−1 and kp = 9.7 h−1, whereas the symbol heights are model-efficiency transformed from ϕ(λ) data via Eq. S17. ○, Bremer and Dennis (6); ×, Scott et al. (10); □, Forchhammer et al. (43). The fp values are consistent with the predicted fitness peak, if the evolutionary target is to maximize the energy efficiency of the fastest-growing cells.
Fig. 4.
Fig. 4.
Behaviors of the model cell. (A) Growth efficiency ε (30, 31) (solid blue) and its components εp (solid green) and εr (solid red) (Eq. S20); efficiency in the absence of protein turnover ε(γ=0) (dashed blue). (B) A Lineweaver–Burk plot linearizes the reciprocals of yield (1/ε) and growth rate (1/λ) from the model. •, experimental maximum biomass yield per unit ATP, εmax=13.9 gDCW/mol ATP (30). (C–E) How the concentrations of ribosomes (R), NRPs (P), and ATP (A) depend on glucose concentration G. Ribosomal density in units of 104 ribosomes/fL is displayed in red and compares well against ref. . (F) The flux of ATP into R and P for different growth conditions, G, total ATP generation flux maJa (blue), and ATP consumption fluxes for biosynthesis of ribosomes mrJr (red) and NRPs mpJp (green) in units of moles per liter per hour (Eq. 10). (G) Predictions of fractional ATP flux toward synthesis of ribosomes jr=(mrJr)/(maJa) (red) and NRPs jp=(mpJp)/(maJa) (green). (H) Fraction of ATP flux used for NRP synthesis split between dilution (λP)/Jp (dashed green) and degradation (λγ)/Jp (solid green).
Fig. 5.
Fig. 5.
Net peptide elongation rate, per ribosome, kper, in units of amino acids per second per ribosome vs. cell growth rates, taken over both RPs and NRPs. The solid symbols are direct observations of peptide chain elongation (–39). The red solid and the dashed lines are predictions with NRP turnover rate γ=0.1 h−1 and γ=0, respectively [Eq. S14a; fp=fp. (…) indicates maximal translation rate].

References

    1. Monod J. The growth of bacterial cultures. Annu Rev Microbiol. 1949;3:371–394.
    1. Hinshelwood CN. On the chemical kinetics of autosynthetic systems. J Chem Soc. 1952:745–755.
    1. Ehrenberg M, Kurland CG. Costs of accuracy determined by a maximal growth rate constraint. Q Rev Biophys. 1984;17(1):45–82. - PubMed
    1. Koch AL. Why can’t a cell grow infinitely fast? Can J Microbiol. 1988;34(4):421–426. - PubMed
    1. Cox RA. Quantitative relationships for specific growth rates and macromolecular compositions of Mycobacterium tuberculosis, Streptomyces coelicolor A3(2) and Escherichia coli B/r: An integrative theoretical approach. Microbiology. 2004;150(Pt 5):1413–1426. - PubMed

Publication types

MeSH terms

Substances