. 2015 Jan 13;112(2):548-53.
doi: 10.1073/pnas.1422456112. Epub 2014 Dec 29.

Evolution of the H9N2 influenza genotype that facilitated the genesis of the novel H7N9 virus

Affiliations

Evolution of the H9N2 influenza genotype that facilitated the genesis of the novel H7N9 virus

Juan Pu et al. Proc Natl Acad Sci U S A. .

Abstract

The emergence of human infection with a novel H7N9 influenza virus in China raises a pandemic concern. Chicken H9N2 viruses provided all six of the novel reassortant's internal genes. However, it is not fully understood how the prevalence and evolution of these H9N2 chicken viruses facilitated the genesis of the novel H7N9 viruses. Here we show that over more than 10 y of cocirculation of multiple H9N2 genotypes, a genotype (G57) emerged that had changed antigenicity and improved adaptability in chickens. It became predominant in vaccinated farm chickens in China, caused widespread outbreaks in 2010-2013 before the H7N9 viruses emerged in humans, and finally provided all of their internal genes to the novel H7N9 viruses. The prevalence and variation of H9N2 influenza virus in farmed poultry could provide an important early warning of the emergence of novel reassortants with pandemic potential.

Keywords: H7N9; H9N2; chicken influenza virus; genotype; infectivity.


Conflict of interest statement

The authors declare no conflict of interest.

Figures

Fig. 1.
Fig. 1.
Isolation rate (%) of H9N2 influenza viruses during 2010–2013 on chicken farms reporting illness in our investigated regions. Histogram indicates monthly isolation rates; red horizontal line (connected with dots) indicates mean annual isolation rates; and gray horizontal dashed line indicates 95% CI.
Fig. 2.
Fig. 2.
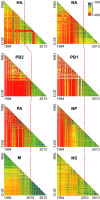
Reduced genetic diversity of the eight segments of H9N2 influenza viruses isolated from chickens during the widespread outbreaks in China (2010–2013). Pairwise comparison of nucleotide sequence of all H9N2 chicken viruses is plotted as a heatmap, if a given pair of sequences shares more than 50% of the full length. Viruses isolated from 1994 through 2013 are ordered by isolation time from left to right on the x axis and from top to bottom on the y axis. Ticks on the axes indicate the isolation years. Red dotted line indicates the year 2010.Color indicates identity levels from ≤90% (red) to 100% (blue) or identity levels unavailable due to the shared sequence length less than 50% (white).
Fig. 3.
Fig. 3.
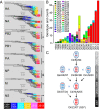
Phylogenetic analysis of H9N2 influenza viruses isolated from chickens during 1994–2013 and H7N9 viruses isolated from humans in China during the first 2 wk of the 2013 outbreak. (A) Phylogenetic trees of surface genes with the H9N2 chicken viruses and those of internal genes with the chicken H9N2 and the novel H7N9 human viruses. Internal gene trees with only H9N2 viruses are not shown here due to the same topology. Clades with most of 2010–2013 viruses were fully shown, and others were collapsed (indicated by gray triangles). Color of line at right of each leaf node indicates year of isolation (see color bar). Timescale is in years. Vertical black lines mark major (long line) and minor (short line) groups of H9N2 viruses, mainly from 2010 through 2013. Black arrows mark the position of H7N9 viruses. Also see Fig. S2. (B) Diversity of genotypes of H9N2 viruses isolated from chickens in China, 1994–2013. Here are shown the recurrent genotypes that were persistent across at least 2 y. All of the genotypes can be found in Dataset S1. (C) Summary of the genesis of genotype G57 by reassortment events. Virus particles are represented by ovals. The eight gene segments are horizontal bars (from the top: PB2, PB1, PA, HA, NP, NA, M, and NS). Red segments are clades of G57; and blue segments are other clades. A broken arrow indicates an interspecies gene transmission. Ck/BJ/94, A/chicken/Beijing/1/1994; Qa/HK/97, A/quail/HongKong/G1/1997; Ck/SH/98, A/chicken/Shanghai/F/1998; Ck/JS/00, A/chicken/Jiangsu/1/2000; Ck/HuN/05, A/chicken/Hunan/5260/2005; Dk/ST/04, A/duck/Shantou/163/2004; Ck/ZJ/07, A/chicken/Zhejiang/HJ/2007 (G57 genotype). Another G57 virus (A/chicken/Jiangxi/12/2007) detected in 2007 is not shown.
Fig. 4.
Fig. 4.
Infection of H9N2 chicken viruses in unvaccinated and vaccinated chickens. Nine representative H9N2 chicken viruses were selected from G57 or other genotypes to test their infection in inoculated and contact chickens. As shown in the figure, from left to right on each x axis, they are A/chicken/Beijing/3/1999 (G02); A/chicken/Hebei/0617/2007 (G51); A/chicken/Shandong/22/2008 (G49); A/chicken/Shandong/ZB/2007 (G60); A/chicken/Jiangsu/TS/2010 (G57); A/chicken/Hebei/YT/2010 (G57); A/chicken/Shandong/sd01/2010 (G57); A/chicken/Shandong/06/2011 (G57); and A/chicken/Guangdong/01/2011 (G68). Chickens (n = 10 per group) were inoculated intranasally with 1× 10⁶ EID50 of each virus to test viral replication. After 24 h, five chickens were placed in physical contact with inoculated birds to test viral transmission. Tracheal (red dashed line) and cloacal (green dashed line) swabs were collected at 3, 5, and 7 dpi for virus detection and/or titration. All of the infection experiments were carried out on unvaccinated (Top) and vaccinated chickens (Middle, with antibody titers of 6–9; Bottom, with antibody titers of 10–12). Antibody titers were expressed as the log2 reciprocal of the end point in HI test. The dashed lines show the differences of infection among different genotype viruses but have no meanings for the real connection with these genotypes. (A) Isolation rates of H9N2 viruses in chickens. (B) Mean titers of H9N2 viruses at 3 dpi. Error bars are SD. The titers of the G57/G68 viruses were significantly higher than those of other genotypes of the earlier viruses (*P < 0.05, **P < 0.01, one-way ANOVA). (C) The viral shedding time of H9N2 viruses.

References

    1. Gao R, et al. Human infection with a novel avian-origin influenza A (H7N9) virus. N Engl J Med. 2013;368(20):1888–1897. - PubMed
    1. World Health Organization (2014) Human infections with avian influenza A(H7N9) virus. Available at www.who.int/influenza/human_animal_interface/influenza_h7n9/140225_H7N9R.... Accessed December 9, 2014.
    1. Liu D, et al. Origin and diversity of novel avian influenza A H7N9 viruses causing human infection: Phylogenetic, structural, and coalescent analyses. Lancet. 2013;381(9881):1926–1932. - PubMed
    1. Lam TT, et al. The genesis and source of the H7N9 influenza viruses causing human infections in China. Nature. 2013;502(7470):241–244. - PMC - PubMed
    1. Wu A, et al. Sequential reassortments underlie diverse influenza H7N9 genotypes in China. Cell Host Microbe. 2013;14(4):446–452. - PubMed

Publication types

MeSH terms

Substances

LinkOut - more resources