

Review
doi: 10.1098/rsta.2014.0091.
Ordinal symbolic analysis and its application to biomedical recordings
Affiliations
- PMID: 25548264
- PMCID: PMC4281864
- DOI: 10.1098/rsta.2014.0091
Item in Clipboard
Review
Ordinal symbolic analysis and its application to biomedical recordings
Philos Trans A Math Phys Eng Sci.
.
Abstract
Ordinal symbolic analysis opens an interesting and powerful perspective on time-series analysis. Here, we review this relatively new approach and highlight its relation to symbolic dynamics and representations. Our exposition reaches from the general ideas up to recent developments, with special emphasis on its applications to biomedical recordings. The latter will be illustrated with epilepsy data.
Keywords: ordinal patterns; permutation entropy; symbolic dynamics; time-series analysis.
© 2014 The Author(s) Published by the Royal Society. All rights reserved.
Figures
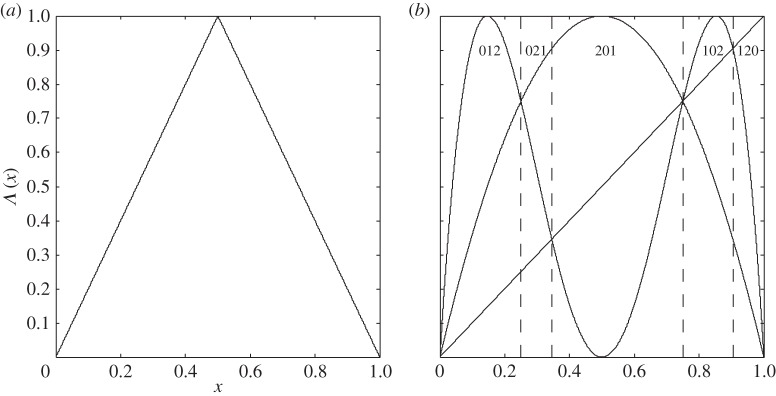
(a) Graph of the tent map. (b) Graphs of the identity map and of f,f2 for f(x)=4x(1−x) determining the ordinal partition π1,3 of [0,1], vertical dashed lines separate subintervals with ordinal patterns (0,1,2),(0,2,1),(2,0,1),(1,0,2) and (1,2,0).
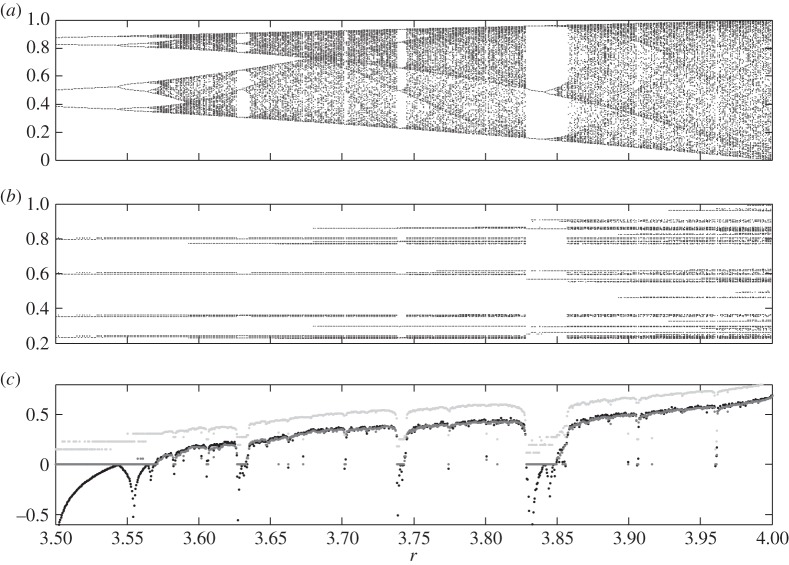
Complexity of the quadratic family: (a) the Feigenbaum diagram, (b) the ordinal version of the Feigenbaum diagram and (c) the corresponding Lyapunov exponents (black), permutation entropy h1,10 (light grey) and the conditional entropies of ordinal patterns (dark grey).
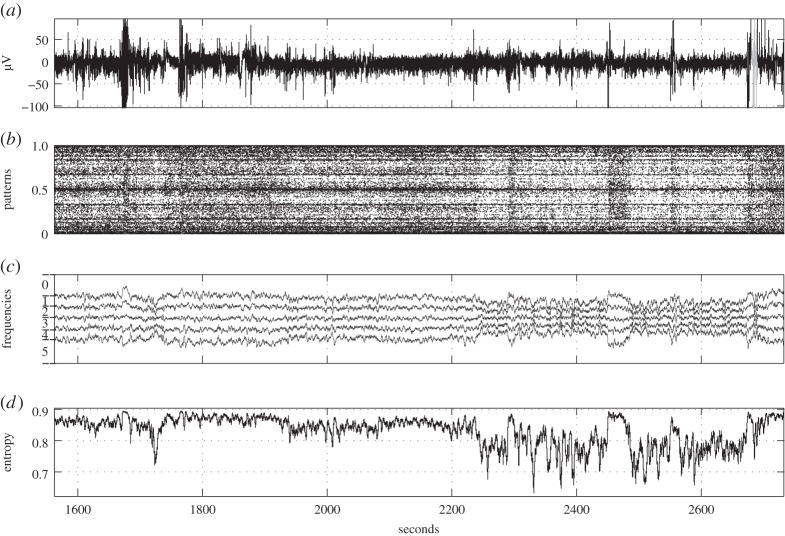
EEG example 1. (a) Original time series with epilepsy caused by inflammation (epileptic seizure is marked in grey), (b) corresponding time series of ordinal patterns (T=1, L=7) as numbers in [0, 1], (c) relative frequencies of the six ordinal 3-patterns (cf. table 1) in a sliding window of 2 s with partitioning in the vertical direction (ordinal pattern distribution, T=1, L=3) and (d) permutation entropy (T=1, L=3) for a sliding window of 2 s.
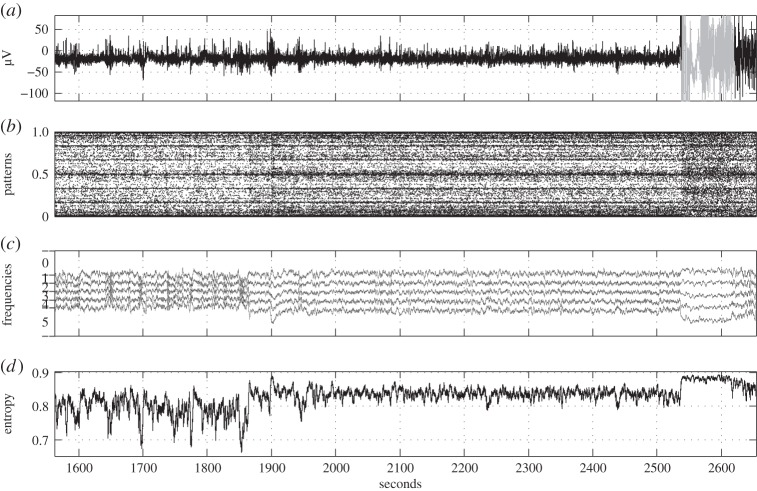
EEG example 2. (a) Original time series with epilepsy caused by hippocampal sclerosis (epileptic seizure is marked in grey), (b) corresponding time series of ordinal patterns (T=1, L=7) as numbers in [0, 1], (c) relative frequencies of the six ordinal 3-patterns (cf. table 1) in a sliding window of 2 s with partitioning in the vertical direction (ordinal pattern distribution, T=1, L=3) and (d) permutation entropy (T=1, L=3) for a sliding window of 2 s.
References
-
- Kantz H, Schreiber T. 2004. Nonlinear time series analysis. Cambridge, UK: Cambridge University Press.
-
- Sprott JC. 2003. Chaos and time-series analysis. Oxford, UK: Oxford University Press.
-
- MacKay D, McCulloch WS. 1952. The limiting information capacity of a neuronal link. Bull. Math. Biophys. 14, 127–135. ( 10.1007/BF02477711) - DOI
Publication types
MeSH terms
LinkOut - more resources
Full Text Sources
Other Literature Sources