. 2015 Feb 27;290(9):5606-20.
doi: 10.1074/jbc.M114.632463. Epub 2014 Dec 29.

A cyclooxygenase-2-dependent prostaglandin E2 biosynthetic system in the Golgi apparatus

Affiliations

A cyclooxygenase-2-dependent prostaglandin E2 biosynthetic system in the Golgi apparatus

Chong Yuan et al. J Biol Chem. .

Abstract

Cyclooxygenases (COXs) catalyze the committed step in prostaglandin (PG) biosynthesis. COX-1 is constitutively expressed and stable, whereas COX-2 is inducible and short lived. COX-2 is degraded via endoplasmic reticulum (ER)-associated degradation (ERAD) following post-translational glycosylation of Asn-594. COX-1 and COX-2 are found in abundance on the luminal surfaces of the ER and inner membrane of the nuclear envelope. Using confocal immunocytofluorescence, we detected both COX-2 and microsomal PGE synthase-1 (mPGES-1) but not COX-1 in the Golgi apparatus. Inhibition of trafficking between the ER and Golgi retarded COX-2 ERAD. COX-2 has a C-terminal STEL sequence, which is an inefficient ER retention signal. Substituting this sequence with KDEL, a robust ER retention signal, concentrated COX-2 in the ER where it was stable and slowly glycosylated on Asn-594. Native COX-2 and a recombinant COX-2 having a Golgi targeting signal but not native COX-1 exhibited efficient catalytic coupling to mPGES-1. We conclude that N-glycosylation of Asn-594 of COX-2 occurs in the ER, leading to anterograde movement of COX-2 to the Golgi where the Asn-594-linked glycan is trimmed prior to retrograde COX-2 transport to the ER for ERAD. Having an inefficient ER retention signal leads to sluggish Golgi to ER transit of COX-2. This permits significant Golgi residence time during which COX-2 can function catalytically. Cytosolic phospholipase A2α, which mobilizes arachidonic acid for PG synthesis, preferentially translocates to the Golgi in response to physiologic Ca(2+) mobilization. We propose that cytosolic phospholipase A2α, COX-2, and mPGES-1 in the Golgi comprise a dedicated system for COX-2-dependent PGE2 biosynthesis.

Keywords: Arachidonic Acid (AA) (ARA); Aspirin; COPII; Coxib; Cyclooxygenase (COX); Degron; Endoplasmic Reticulum-associated Protein Degradation (ERAD); Glycoprotein; NSAID; Prostaglandin.


Figures

FIGURE 1.
FIGURE 1.
Domain structures and degradation of huCOX-2 constructs targeted to different organelles. A, domain structures of huCOX-2, KDEL huCOX-2, and Golgi-ΔSTEL huCOX-2 constructs indicating known sites of N-glycosylation. The signal peptide of huCOX-2 was replaced with the N terminus of β-1,4-galactosyltransferase in preparing Golgi-ΔSTEL huCOX-2. These various constructs and homologs having N594A substitutions were prepared and used for stable, tetracycline-inducible expression in HEK293 cells as described under “Experimental Procedures.” SP, signal peptide; EGF, EGF domain; MBD, membrane binding domain; CatD, catalytic domain. The sequences of the C-terminal ER retention signal of the constructs differ as indicated. B, degradation of different huCOX-2 variants and their N594A homologs. HEK293 cells were cultured to express the indicated variants, and disappearance of COX-2 with time following the addition of puromycin was monitored by Western transfer blotting as detailed under “Experimental Procedures.” The two arrows shown next to the blot for KDEL huCOX-2 denote the two glycosylated forms of protein and the time-dependent increase of the slower mobility species. The primary antibody for all the Western blots shown in this figure was a rabbit anti-huCOX-2 antibody prepared against a peptide with the sequence from Pro-583 to Asn-594 of huCOX-2 (29). Experiments were repeated at least three times with similar results. C, densitometric measurement of COX-2 degradation. Densitometry was performed as described under “Experimental Procedures” using ImageJ software. Data are shown as mean ± S.D. (error bars). Based on repeat measure of ANOVA (IBM SPSS Statistics 21), the rate of degradation between huCOX-2 and N594A huCOX-2 and between Golgi-ΔSTEL huCOX-2 and N594A Golgi-ΔSTEL huCOX-2 are significantly different (p < 0.05). The differences are denoted by an asterisk in each case. N594A huCOX-2, KDEL huCOX-2, and N594A KDEL huCOX-2 are not degraded at appreciable rates. D, effect of tunicamycin on the degradation of KDEL huCOX-2. COX-2 degradation was measured essentially as described for B and C above. Tunicamycin at the indicated concentrations was added to the medium at the same time as puromycin, and cells were harvested at either 0, 8, or 24 h following the addition of puromycin. The fractions of COX-2 in the upper and lower bands of KDEL huCOX-2 observed 24 h following the addition of tunicamycin and puromycin were determined by densitometry and are shown in the lower panel. E, effect of inhibitors of lysosomal degradation on the degradation of native huCOX-2. Experiments were performed essentially as described in B above but in the presence of the indicated concentrations of inhibitors of lysosomal proteolysis. Tet, tetracycline.
FIGURE 2.
FIGURE 2.
Protein trafficking inhibitors attenuate the degradation of huCOX-2 via the ERAD pathway. A, effects of inhibitors on the degradation of huCOX-2 heterologously expressed in HEK293 cells. Degradation experiments were performed as described under “Experimental Procedures” and the legend to Fig. 1B. For the experiments shown in this panel, puromycin was added to all the samples (i.e. both in the presence and absence of trafficking inhibitors). The following inhibitors were tested: MG132 (20 μm), H-89 (20 μm), and AlF4 (50 μm AlCl3 plus 30 mm NaF). Data are shown as mean ± S.D. (error bars). Based on repeated measures of ANOVA (IBM SPSS Statistics 21), the differences between the control group without drug treatment and the treated groups except for AlF4 are statistically significant (p < 0.05) from zero time to 24 h. The AlF4-treated group differs from the control group at 8 and 24 h (p < 0.05). These differences are denoted with asterisks. B, effects of inhibitors on the degradation of endogenous native muCOX-2 in murine NIH 3T3 fibroblasts. NIH 3T3 cells were cultured to express COX-2 as detailed under “Experimental Procedures.” After the cells were treated with inhibitors for 1 h, cycloheximide (50 μm) was added to block translation along with the amounts of inhibitors indicated in A above. Cells were collected at the indicated times, and proteins were subjected to Western blotting. The densitometry measurements of muCOX-2 are based on two separate experiments. The primary antibody used for the experiments with murine NIH 3T3 cells was a commercial antibody from Novus Biologicals. Data are shown as mean ± S.D. (error bars). Based on repeated measures of ANOVA (IBM SPSS Statistics 21), the differences between the control group without drug treatment and the MG132- and H-89-treated groups are statistically significant (p < 0.05) from 0 to 24 h. These differences are denoted with asterisks.
FIGURE 3.
FIGURE 3.
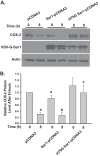
Dominant negative H79G Sar1 attenuates the degradation of huCOX-2 via the ERAD pathway. A, Western transfer blots from experiments to determine the effect of Sar1 variants on the degradation of huCOX-2 expressed heterologously in HEK293 cells. As described under “Experimental Procedures,” HEK293 cells stably expressing native huCOX-2 were (a) transfected with pCDNA-3, Sar1-pCDNA-3, or H79G Sar1-pCDNA-3; (b) treated with tetracycline to induce COX-2; and (c) incubated with puromycin for 0 or 8 h. COX-2, VSV-G-tagged Sar1, and actin protein levels at 0 and 8 h were then analyzed by Western blotting. B, the relative amounts of immunoreactive huCOX-2 protein normalized to COX-2 density in the pCDNA-3 cells at the 0-h puromycin time point. Values were determined by densitometry of Western blots and represent mean values ± S.D. (error bars) from three independent experiments. Tukey's multiple comparison test was used to determine statistically significant differences in densities (p < 0.05) and are indicated in the figure as follows: a, value different from zero time value for pCDNA3; b, value different from zero time value for Sar1-pCDNA3; and c, value different from 8-h value for pCDNA-3 and 8-h value for Sar1-pCDNA-3. There was no statistically significant difference between the COX-2 levels at 0 h in cells treated with pCDNA3 versus H79G Sar1-pCDNA3.
FIGURE 4.
FIGURE 4.
Subcellular localization by confocal fluorescence microscopy of COX-1 and COX-2 variants and mPGES-1. A, co-localization with the Golgi marker giantin of various huCOX-2 variants expressed heterologously in HEK293 cells and endogenous muCOX-2 expressed in NIH 3T3 fibroblasts. HEK293 cell lines stably and inducibly expressing different huCOX-2 variants were cultured in four-chambered slides and subjected to immunocytofluorescence as detailed under “Experimental Procedures.” The primary antibodies used were rabbit polyclonal anti-giantin antibody and murine monoclonal anti-COX-2 antibody. Microscopy was conducted on a Nikon Infinity confocal microscope at a magnification of 100×. B, co-localization of huCOX-1 in HEK293 cells, ovCOX-1 in HEK293 cells, and huCOX-1 in CCL210 human lung fibroblasts with Golgi (giantin) and ER (calnexin) markers. For CCL210 cells, the slides were directly fixed and prepared 1 day after seeding the cells. The protocols used for staining the HEK293 cells were as described in A above. The primary antibodies used were mouse monoclonal anti-COX-1 and either rabbit polyclonal anti-giantin or rabbit polyclonal anti-calnexin. C, CC values for co-localization of different COX-1 and COX-2 variants with the Golgi marker giantin were determined as detailed under “Experimental Procedures”. Based on the one-way ANOVA for multiple comparisons (GraphPad Prism), a difference between CC values for huCOX-2 in HEK293 cells, muCOX-2 in 3T3 cells, and Golgi-ΔSTEL huCOX-2 in HEK293 cells and the CC values for COX-1 and other COX-2 variants are statistically significant (p < 0.05) as denoted with asterisks (*). No significant difference was observed between huCOX-2 in HEK293 cells and muCOX-2 in 3T3 cells. D, co-localization of mPGES-1 with the Golgi marker giantin and the ER marker calnexin in human dermal fibroblasts (HDFn). Human dermal fibroblasts were cultured to express endogenous huCOX-2, and immunocytofluorescence was performed as described under “Experimental Procedures”. A mouse monoclonal antibody to mPGES-1 was used as the primary antibody.
FIGURE 5.
FIGURE 5.
PGE2 formation by HEK293 cells inducibly expressing various huCOX-IRES-mPGES-1 variants. HEK293 cell lines were developed that inducibly express huCOX-1-IRES-mPGES-1, Golgi-ΔSTEL huCOX-1-IRES-mPGES-1, huCOX-2-IRES-mPGES-1, KDEL huCOX-2-IRES-mPGES-1, or Golgi-ΔSTEL huCOX-2-IRES-mPGES-1 as described under “Experimental Procedures”. Cultured cells from each of these lines and from a sham-transfected HEK cell line were subjected to serum starvation for 24 h and then tetracycline treatment for 24 h to induce formation of a COX variant plus mPGES-1; both treatments were performed in the presence of 0.25–1 μm AA. The cells were then treated for 1 h with 20 μm MG132 to minimize ERAD. A, Western transfer blotting of COX-1 or COX-2 and mPGES-1 was performed as described under “Experimental Procedures” using 12 μg of total cell protein from each of the indicated cell lines. No COX or mPGES-1 immunoreactivity was observed using protein from the sham-transfected cells (not shown). The entire gel was stained for actin and mPGES-1, and segments of the gels were then stained for huCOX-1 or huCOX-2. B, PGE2 formation by HEK293 cell lines inducibly expressing the COX-IRES-mPGES-1 variants in panel Α above. The cell lines were incubated with either 12 μm AA for 10 min or 2 μm A23187 for 45 min, the supernatants were collected, and PGE2 levels were quantified using a PGE2 enzyme immunoassay kit or a standard RIA. Data are from four separate experiments performed at different times with different preparations of the cultured cells. No PGE2 was formed by sham-transfected HEK293 cells (not shown). The ratios of the amounts of PGE2 formed after treatment with A23187 (i.e. from endogenous AA) compared with the amounts of PGE2 formed after treatment with 12 μm AA (×10−3) (i.e. from exogenous AA) are shown under the brackets. Based on the one-way ANOVA for multiple comparisons (GraphPad Prism), the differences in the ratios (A23187/exogenous 12 μm AA) between the huCOX-2-IRES-mPGES-1 and both KDEL huCOX-2-IRES-mPGES-1 and Golgi-ΔSTEL huCOX-2-IRES-mPGES-1 are statistically significant (p < 0.05); in addition, the differences in the ratios between huCOX-1-IRES-mPGES-1 and both Golgi-ΔSTEL huCOX-1-IRES-mPGES-1 and huCOX-2-IRES-mPGES-1 are statistically significant (p < 0.05). These statistically significant differences are denoted with asterisks.
FIGURE 6.
FIGURE 6.
Model of COX-2 synthesis, trafficking and ERAD that provides for COX-2-mediated PGE2 biosynthesis in the Golgi apparatus. A, translation and entry of COX-2 into the lumen of the ER during which COX-2 is co-translationally N-glycosylated at Asn-68, Asn-144, and Asn-410. B, post-translational N-glycosylation of Asn-594. C, trimming by glucosidases I and II to generate an ER outing signal. D, incorporation of COX-2 into a COPII vesicle, anterograde transport to the cis-Golgi apparatus, and transfer to the lumen of the cis-Golgi. E, trimming of the Asn-594-linked carbohydrate moiety by ER mannosidase-1 (ERMan-1) to yield a COX-2 available for retrograde transport. F, retrograde transport of COX-2 to the ER involving the KDEL receptor interacting with the weak ER retention sequence STEL at the C terminus of COX-2. G, further processing of the Asn-594-linked group of modified COX-2 perhaps to Man7(GlcNAc)2-Asn-594. H, ubiquitination and transport to the cytosol for proteasomal degradation. I, COX-1 localized to the lumen of the ER. J, formation of a COX-2-mediated PGE2 synthetic system involving cPLA translocated in a Ca2+-dependent manner from the cytosol to the surface of the Golgi, COX-2 in the Golgi apparatus, and Golgi-localized mPGES-1.

References

    1. Narumiya S., Furuyashiki T. (2011) Fever, inflammation, pain and beyond: prostanoid receptor research during these 25 years. FASEB J. 25, 813–818 - PubMed
    1. Majed B. H., Khalil R. A. (2012) Molecular mechanisms regulating the vascular prostacyclin pathways and their adaptation during pregnancy and in the newborn. Pharmacol. Rev. 64, 540–582 - PMC - PubMed
    1. Patrono C., García Rodríguez L. A., Landolfi R., Baigent C. (2005) Low-dose aspirin for the prevention of atherothrombosis. N. Engl. J. Med. 353, 2373–2383 - PubMed
    1. Yu Y., Ricciotti E., Scalia R., Tang S. Y., Grant G., Yu Z., Landesberg G., Crichton I., Wu W., Puré E., Funk C. D., FitzGerald G. A. (2012) Vascular COX-2 modulates blood pressure and thrombosis in mice. Sci. Transl. Med. 4, 132ra54 - PMC - PubMed
    1. Schneider C., Pratt D. A., Porter N. A., Brash A. R. (2007) Control of oxygenation in lipoxygenase and cyclooxygenase catalysis. Chem. Biol. 14, 473–488 - PMC - PubMed

Publication types

MeSH terms