. 2014 Dec;40(6):1445-52.
doi: 10.1002/jmri.24478. Epub 2013 Nov 13.

Gannet: A batch-processing tool for the quantitative analysis of gamma-aminobutyric acid–edited MR spectroscopy spectra

Gannet: A batch-processing tool for the quantitative analysis of gamma-aminobutyric acid–edited MR spectroscopy spectra

Richard A E Edden et al. J Magn Reson Imaging. 2014 Dec.

Abstract

Purpose: The purpose of this study is to describe the Gannet toolkit for the quantitative batch analysis of gamma-aminobutyric acid (GABA) -edited MRS data.

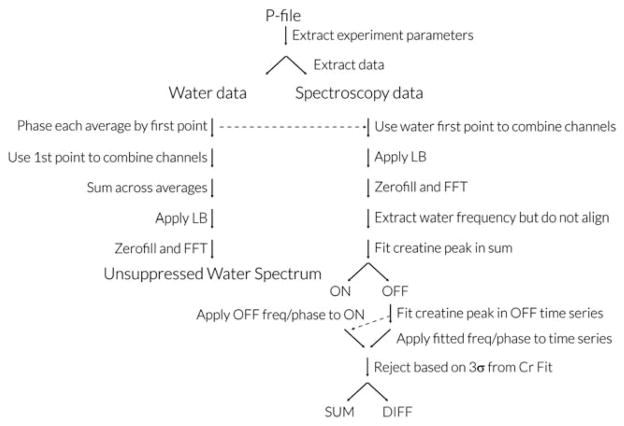
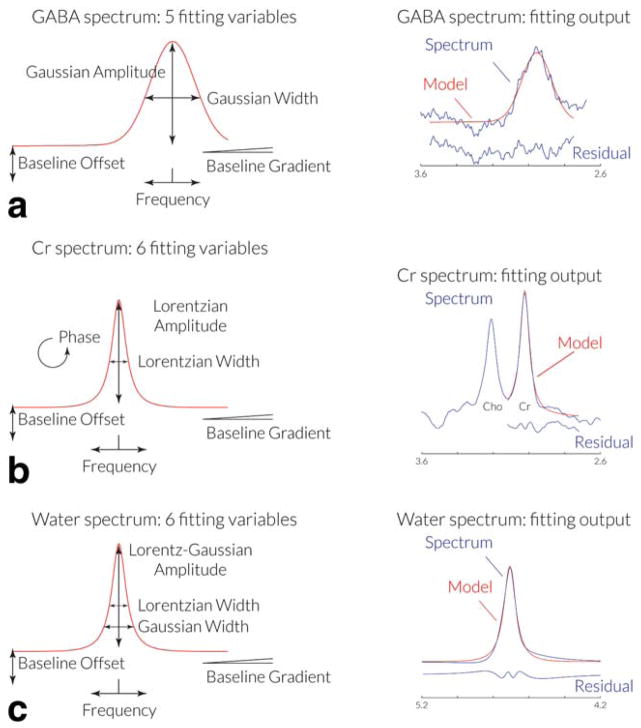
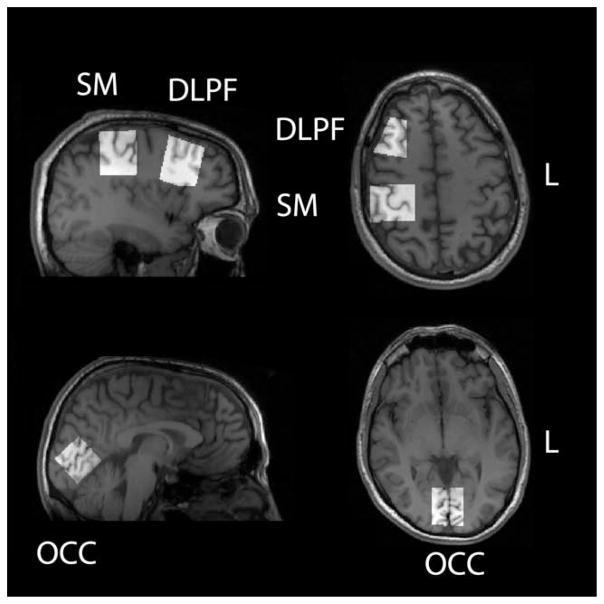
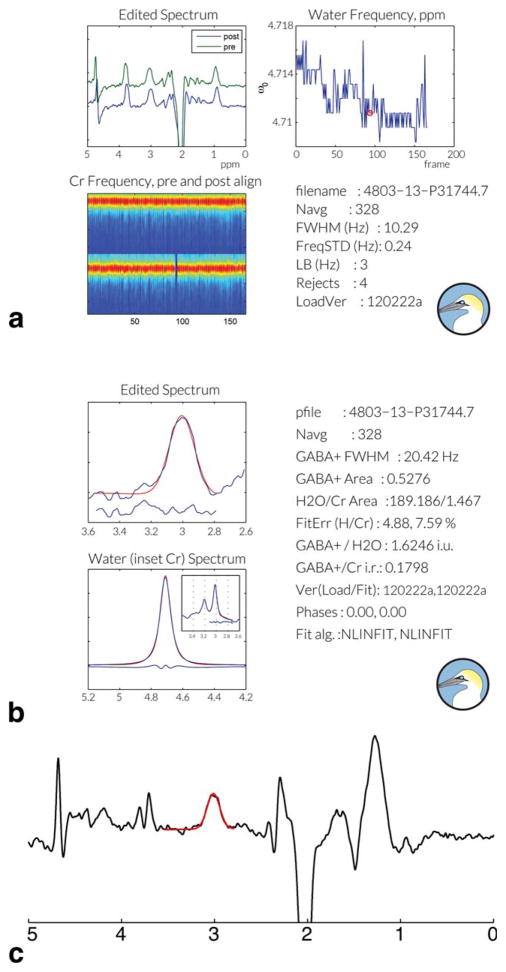
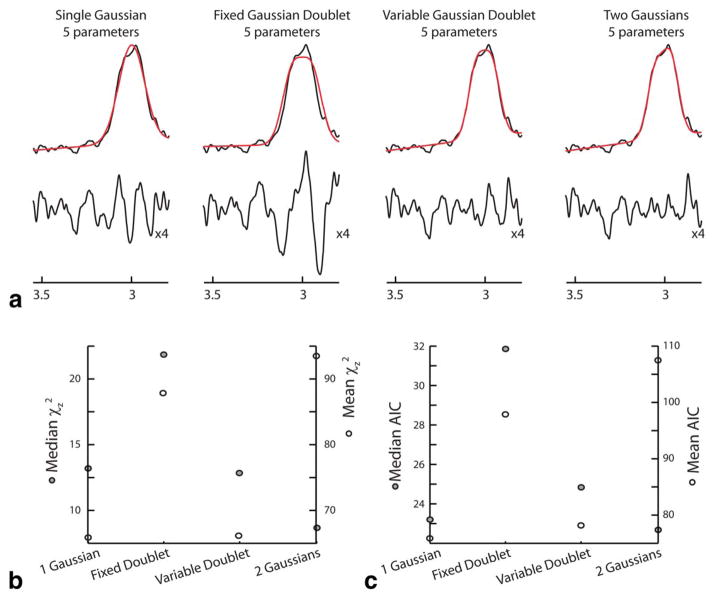
Materials and methods: Using MEGA-PRESS editing and standard acquisition parameters, four MEGA-PRESS spectra were acquired in three brain regions in 10 healthy volunteers. These 120 datasets were processed without user intervention with Gannet, a Matlab-based tool that takes raw time-domain data input, processes it to generate the frequency-domain edited spectrum, and applies a simple modeling procedure to estimate GABA concentration relative to the creatine or, if provided, the unsuppressed water signal. A comparison of four modeling approaches is also presented.

Results: All data were successfully processed by Gannet. Coefficients of variation across subjects ranged from 11% for the occipital region to 17% for the dorsolateral prefrontal region. There was no clear difference in fitting performance between the simple Gaussian model used by Gannet and the other more complex models presented.

Conclusion: Gannet, the GABA Analysis Toolkit, can be used to process and quantify GABA-edited MRS spectra without user intervention.


Figures

Figure 1
Figure 1
Gannet Processing pipeline for GE p-file data. Processing for Philips .sdat and .data files proceeds along similar lines, except in both cases header information is contained in a separate parameter file, .spar and .list, respectively, and phased-array channel combination is performed automatically before data export. Siemens data are exported as time-averaged, time-domain data, so fewer steps are applicable.
Figure 2
Figure 2
GannetFit modeling of spectra. a: A Gaussian model with five variable parameters is used to model the edited GABA signal in the DIFF spectrum. b: A Lorentzian model with six variable parameters is used to model the Cr signal from the OFF spectrum. c: A Gaussian-Lorentzian model with six variable parameters is used to model the water signal from the unsuppressed water spectrum. [Color figure can be viewed in the online issue, which is available at wileyonlinelibrary.com.]
Figure 3
Figure 3
Voxel locations. Four repeat GABA-edited MRS spectra were acquired in ten subjects in the occipital (OCC), sensorimotor (SM), and dorsolateral prefrontal (DLPF) voxels shown. The voxel position was determined based upon T1-weighted anatomical images as shown.
Figure 4
Figure 4
Gannet Output. For each dataset analyzed, pdf output is saved by both the (a) GannetLoad and (b) Gannet-Fit modules. Outputs display both graphical and quantitative information to allow users to access data and fit quality. In the GannetLoad output, rejected shots appear as blue lines in the bottom left panel and are marked with red circles in the top right panel. c: Gannet can also be applied to the analysis of MM-suppressed GABA-edited data.
Figure 5
Figure 5
Model Comparison. All data were fit by four models: single Gaussian, fixed Gaussian doublet; variable Gaussian doublet; and two free Gaussians. Data for a representative dataset are shown in (a) with fits in red and residuals (expanded vertically by four) below. b: Mean (white points, right-hand axis) and median (gray points, left-hand axis) χz2 values over all 120 datasets. c: Mean (white points, right-hand axis) and median (gray points, left-hand axis) AIC values over all 120 data-sets. [Color figure can be viewed in the online issue, which is available at wileyonlinelibrary.com.]

References

    1. Mullins PG, McGonigle DJ, O’Gorman RL, et al. Current practice in the use of MEGA-PRESS spectroscopy for the detection of GABA. Neuroimage. 2013 doi: 10.1016/j.neuroimage.2012.12.004. Epub. - DOI - PMC - PubMed
    1. Puts NA, Edden RA. In vivo magnetic resonance spectroscopy of GABA: a methodological review. Prog Nucl Magn Reson Spectrosc. 2012;60:29–41. - PMC - PubMed
    1. Muthukumaraswamy SD, Evans CJ, Edden RA, Wise RG, Singh KD. Individual variability in the shape and amplitude of the BOLD-HRF correlates with endogenous GABAergic inhibition. Hum Brain Mapp. 2012;33:455–465. - PMC - PubMed
    1. Puts NA, Edden RA, Evans CJ, McGlone F, McGonigle DJ. Regionally specific human GABA concentration correlates with tactile discrimination thresholds. J Neurosci. 2011;31:16556–16560. - PMC - PubMed
    1. Stagg CJ, Bachtiar V, Johansen-Berg H. The role of GABA in human motor learning. Curr Biol. 2011;21:480–484. - PMC - PubMed

Publication types

Substances