Meta-Analysis
. 2014 Dec 30;9(12):e115904.
doi: 10.1371/journal.pone.0115904. eCollection 2014.

A meta-analysis of zilpaterol and ractopamine effects on feedlot performance, carcass traits and shear strength of meat in cattle

Affiliations
Meta-Analysis

A meta-analysis of zilpaterol and ractopamine effects on feedlot performance, carcass traits and shear strength of meat in cattle

Ian J Lean et al. PLoS One. .

Abstract

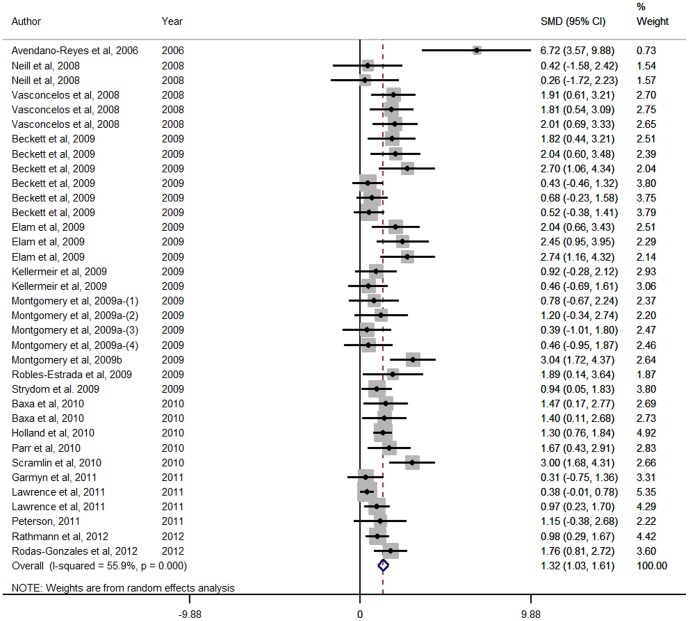
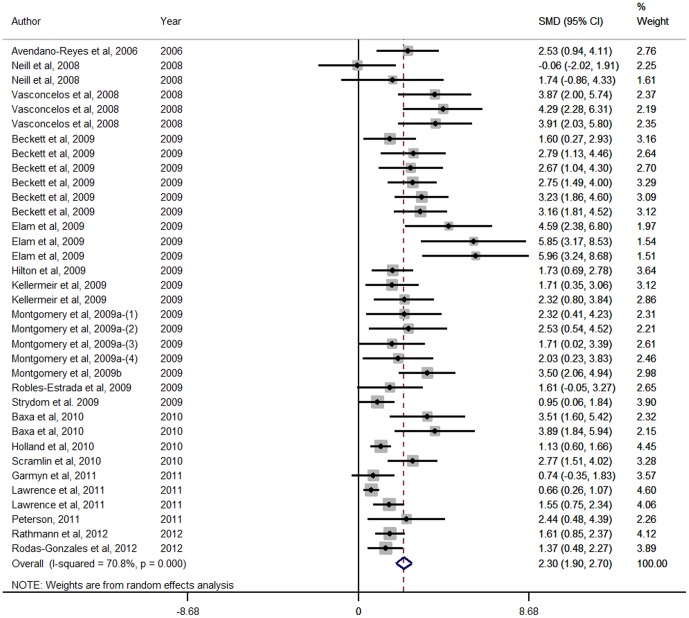
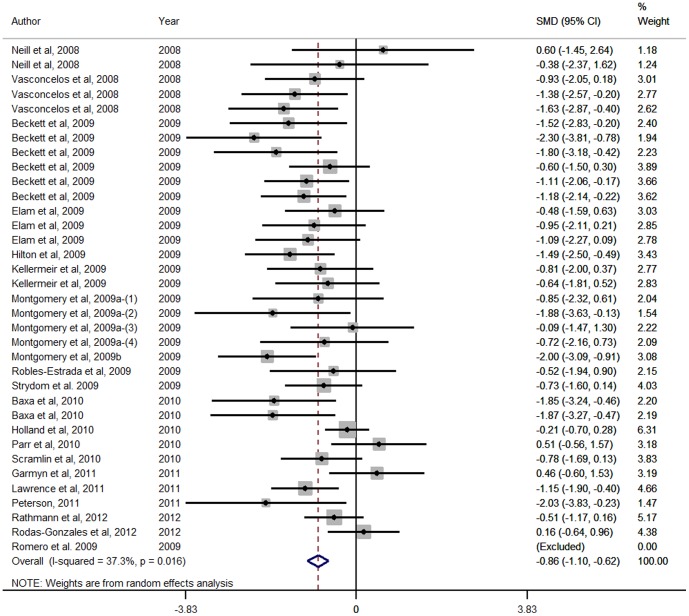
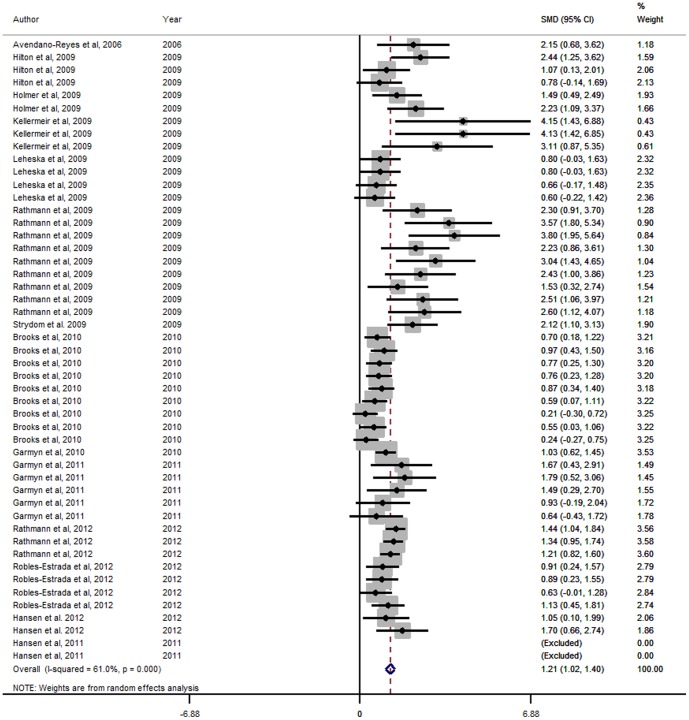
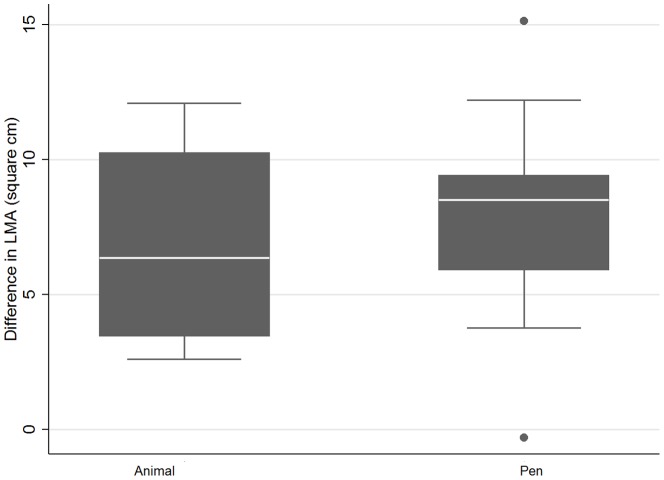
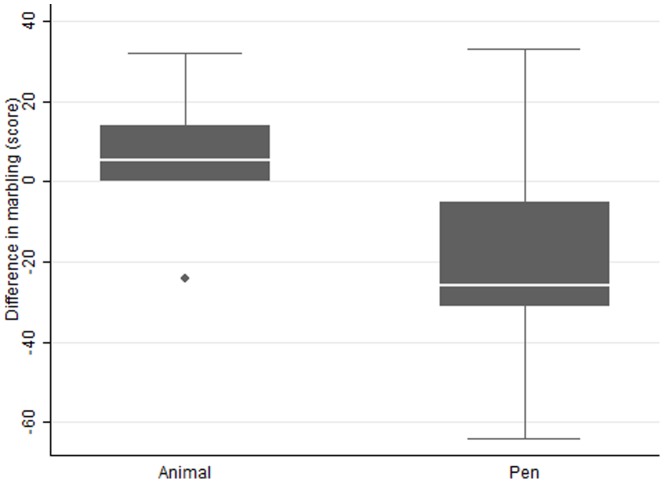
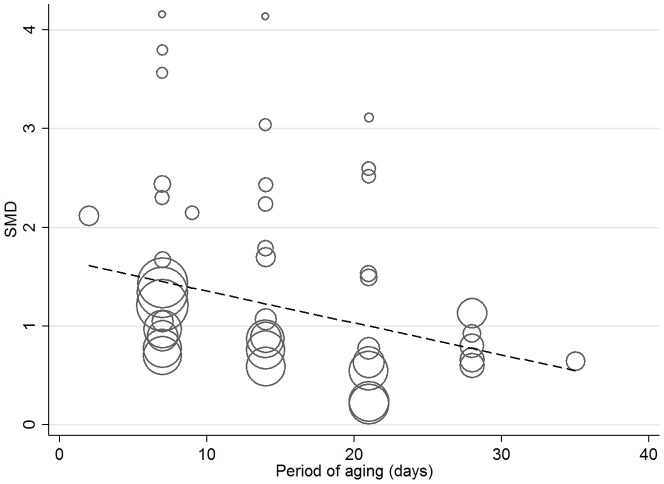
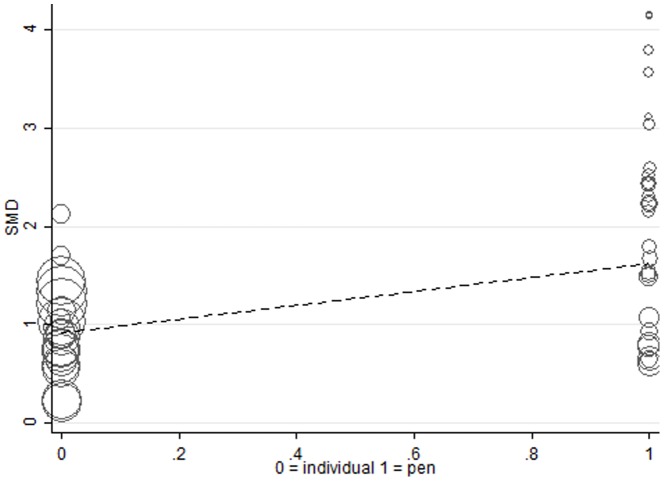
This study is a meta-analysis of the effects of the beta-agonists zilpaterol hydrochloride (ZH) and ractopamine hydrochloride (RAC) on feedlot performance, carcase characteristics of cattle and Warner Bratzler shear force (WBSF) of muscles. It was conducted to evaluate the effect of the use of these agents on beef production and meat quality and to provide data that would be useful in considerations on the effect of these agents on meat quality in Meat Standards Australia evaluations. We conducted a comprehensive literature search and study assessment using PubMed, Google Scholar, ScienceDirect, Scirus, and CAB and identification of other studies from reference lists in papers and searches. Searches were based on the key words: zilpaterol, zilmax, ractopamine, optaflexx, cattle and beef. Studies from theses obtained were included. Data were extracted from more than 50 comparisons for both agents and analysed using meta-analysis and meta-regression. Both agents markedly increased weight gain, hot carcase weight and longissimus muscle area and increased the efficiency of gain:feed. These effects were particularly large for ZH, however, fat thickness was decreased by ZH, but not RAC. Zilpaterol also markedly increased WBSF by 1.2 standard deviations and more than 0.8 kg, while RAC increased WBSF by 0.43 standard deviations and 0.2 kg. There is evidence in the ZH studies, in particular, of profound re-partitioning of nutrients from fat to protein depots. This work has provided critically needed information on the effects of ZH and RAC on production, efficiency and meat quality.


Conflict of interest statement

Competing Interests: IJL has received funding for research into rumen function in cattle from Elanco Animal Health. SBScibus has no commercial interest in the outcomes of this meta-analysis, nor any influencing role as a company. JT reports that while working with the Cooperative Research Centre for Beef Genetic Technologies several projects were funded by Pfizer Animal Health and Pfizer Animal Genetics. He is currently working on a project, in part funded by Elanco Animal Health. Frank R Dunshea has consulted for with Elanco Animal Health as a member of the Swine Nutrition Advisory Panel and has conducted research with ractopamine in swine funded through the Co-operative Research Centre for Internationally Competitive Pork of which Elanco Animal Health is a participating organisation. All three authors are members of the Meat Standards Australia Pathways committee. Meat and Livestock Australia played no role in the study design apart from facilitating and funding the study. It facilitated the study by funding an independent search that identified sufficient studies were present to conduct a meta-analysis. This literature search was made available to the authors but did not provide papers that were not identified by the subsequent systematic literature searches undertaken. The authors have no other competing interests in research funding, employment, patents, products in development or marketing products.

Figures

Figure 1
Figure 1. Forest plot of Hot Carcase Weight responses for Zilpaterol studies.
A Forest plot of the effect size or standardized mean difference (standardized using the z-statistic) and 95% confidence interval of the effect of zilpaterol treatmenton hot standing carcase weight. The weights that each study contributed are in the right hand column and are indicated by the size of the box. The larger the box, the greater the study contribution to the overall estimate. The solid vertical grey line represents a mean difference of zero or no effect. Points to the left of the line represent a reduction in hot carcase weight, while points to the right of the line indicate an increase. The upper and lower limit of the line connected to the square represents the upper and lower 95% confidence interval for the effect size. The overall pooled effects size and 95% confidence interval is indicated by the diamond at the bottom. This effect was heterogenous as indicated by the I2 of 55.9%.
Figure 2
Figure 2. Forest plot of Longissimus muscle area (cm2) responses for Zilpaterol studies.
A Forest plot of the effect size or standardized mean difference (standardized using the z-statistic) and 95% confidence interval of the effect of zilpaterol treatmenton Longissimus muscle area. The weights that each study contributed are in the right hand column and are indicated by the size of the box. The larger the box, the greater the study contribution to the overall estimate. The solid vertical grey line represents a mean difference of zero or no effect. Points to the left of the line represent a reduction in Longissimus muscle area, while points to the right of the line indicate an increase. The upper and lower limit of the line connected to the square represents the upper and lower 95% confidence interval for the effect size. The overall pooled effects size and 95% confidence interval is indicated by the diamond at the bottom. This effect was heterogenous as indicated by the I2 of 70.8%.
Figure 3
Figure 3. Forest plot of Standardised USDA marbling score responses for Zilpaterol studies.
A Forest plot of the effect size or standardized mean difference (standardized using the z-statistic) and 95% confidence interval of the effect of zilpaterol treatmenton USDA Marbling Score. The weights that each study contributed are in the right hand column and are indicated by the size of the box. The larger the box, the greater the study contribution to the overall estimate. The solid vertical grey line represents a mean difference of zero or no effect. Points to the left of the line represent a reduction in Standardised USDA marbling score, while points to the right of the line indicate an increase. The upper and lower limit of the line connected to the square represents the upper and lower 95% confidence interval for the effect size. The overall pooled effects size and 95% confidence interval is indicated by the diamond at the bottom. This effect was relatively homogenous as indicated by the I2 of 37.3%.
Figure 4
Figure 4. Forest plot of Warner-Bratzler Shear Force responses for Zilpaterol studies.
A Forest plot of the effect size or standardized mean difference (standardized using the z-statistic) and 95% confidence interval of the effect of zilpaterol treatmenton Warner-Bratzler Shear Force. The weights that each study contributed are in the right hand column and are indicated by the size of the box. The larger the box, the greater the study contribution to the overall estimate. The solid vertical grey line represents a mean difference of zero or no effect. Points to the left of the line represent a reduction in Warner-Bratzler Shear Force, while points to the right of the line indicate an increase. The upper and lower limit of the line connected to the square represents the upper and lower 95% confidence interval for the effect size. The overall pooled effects size and 95% confidence interval is indicated by the diamond at the bottom. This effect was heterogenous as indicated by the I2 of 61.0%.
Figure 5
Figure 5. Raw mean differences for studies using animal or pen as the unit of interest for the effect of Zilpaterol on Longissimus muscle area (cm2).
The dots in the Figures represent studies that are outliers.
Figure 6
Figure 6. Raw mean differences for studies using animal or pen as the unit of interest for the effect of Zilpaterol on USDA marbling score.
The dots in the Figures represent studies that are outliers.
Figure 7
Figure 7. Meta-regression of the effect of aging of steak (days) on the standardised mean difference of studies examining Zilpaterol and Warner-Bratzler Shear Force.
The regression is weighted by the effect size of studies which are indicated by the size of the marker. The larger the marker, the greater the effect size of the study.
Figure 8
Figure 8. Meta-regression of the effect of individually fed or pen fed on the standardised mean difference of studies examining Zilpaterol and Warner-Bratzler Shear Force.
The regression is weighted by the effect size of studies which are indicated by the size of the marker. The larger the marker, the greater the effect size of the study.
Figure 9
Figure 9. A contour enhanced funnel plot of the effects of RAC on Average Daily Gain.
Figure 10
Figure 10. Forest plot of hot carcass weight for ractopamine studies.
A Forest plot of the effect size or standardized mean difference (standardized using the z-statistic) and 95% confidence interval of the effect of ractopamine treatmenton hot standing carcase weight. The weights that each study contributed are in the right hand column and are indicated by the size of the box. The larger the box, the greater the study contribution to the overall estimate. The solid vertical grey line represents a mean difference of zero or no effect. Points to the left of the line represent a reduction in hot carcass weight, while points to the right of the line indicate an increase. The upper and lower limit of the line connected to the square represents the upper and lower 95% confidence interval for the effect size. The overall pooled effects size and 95% confidence interval is indicated by the diamond at the bottom. This effect was heterogenous as indicated by the I2 of 46.5%.
Figure 11
Figure 11. Forest plot of Standardised USDA marbling score for Ractopamine studies.
A Forest plot of the effect size or standardized mean difference (standardized using the z-statistic) and 95% confidence interval of the effect of ractopamine treatmenton USDA marbling score. The weights that each study contributed are in the right hand column and are indicated by the size of the box. The larger the box, the greater the study contribution to the overall estimate. The solid vertical grey line represents a mean difference of zero or no effect. Points to the left of the line represent a reduction in Standardised USDA marbling score, while points to the right of the line indicate an increase. The upper and lower limit of the line connected to the square represents the upper and lower 95% confidence interval for the effect size. The overall pooled effects size and 95% confidence interval is indicated by the diamond at the bottom. This effect was homogenous as indicated by the I2 of 0.8%.
Figure 12
Figure 12. Forestplot of Warner-Bratzler Shear Force for ractopamine studies.
A Forest plot of the effect size or standardized mean difference (standardized using the z-statistic) and 95% confidence interval of the effect of ractopamine treatmenton Warner-Bratzler Shear Force. The weights that each study contributed are in the right hand column and are indicated by the size of the box. The larger the box, the greater the study contribution to the overall estimate. The solid vertical grey line represents a mean difference of zero or no effect. Points to the left of the line represent a reduction in Warner-Bratzler Shear Force, while points to the right of the line indicate an increase. The upper and lower limit of the line connected to the square represents the upper and lower 95% confidence interval for the effect size. The overall pooled effects size and 95% confidence interval is indicated by the diamond at the bottom. This effect was homogenous as indicated by the I2 of 0%.

References

    1. Pringle TD, Calkins CR, Koohmaraie M, Jones SJ (1993) Effects over time of feeding a beta-adrenergic agonist to wether lambs on animal performance, muscle growth, endogenous muscle proteinase activities, and meat tenderness. J Anim Sci 71:636–644. - PubMed
    1. Crome PK, McKeith FK, Carr TR, Jones DJ. Mowrey DH, et al. (1996) Effect of ractopamine on growth performance, carcass composition, and cutting yields of pigs slaughtered at 107 and 125 kilograms. J Anim Sci 74:709–716. - PubMed
    1. Liu CY, Mills SE (1989) Determination of the affinity of ractopamine and clenbuterol for the beta-adrenoceptor of the porcine adipocyte. J Anim Sci 67:2937–2942. - PubMed
    1. Dunshea FR (1993) Effect of metabolism modifiers on lipid metabolism in the pig. J Anim Sci 71:1966–1977. - PubMed
    1. Mersmann HJ (1998) Overview of the effects of beta-adrenergic receptor agonists on animal growth including mechanisms of action. J Anim Sci 76:160–172. - PubMed

Publication types

LinkOut - more resources