. 2014 Dec 30;12(12):e1002029.
doi: 10.1371/journal.pbio.1002029. eCollection 2014 Dec.

Electrochemical regulation of budding yeast polarity

Affiliations

Electrochemical regulation of budding yeast polarity

Armin Haupt et al. PLoS Biol. .

Abstract

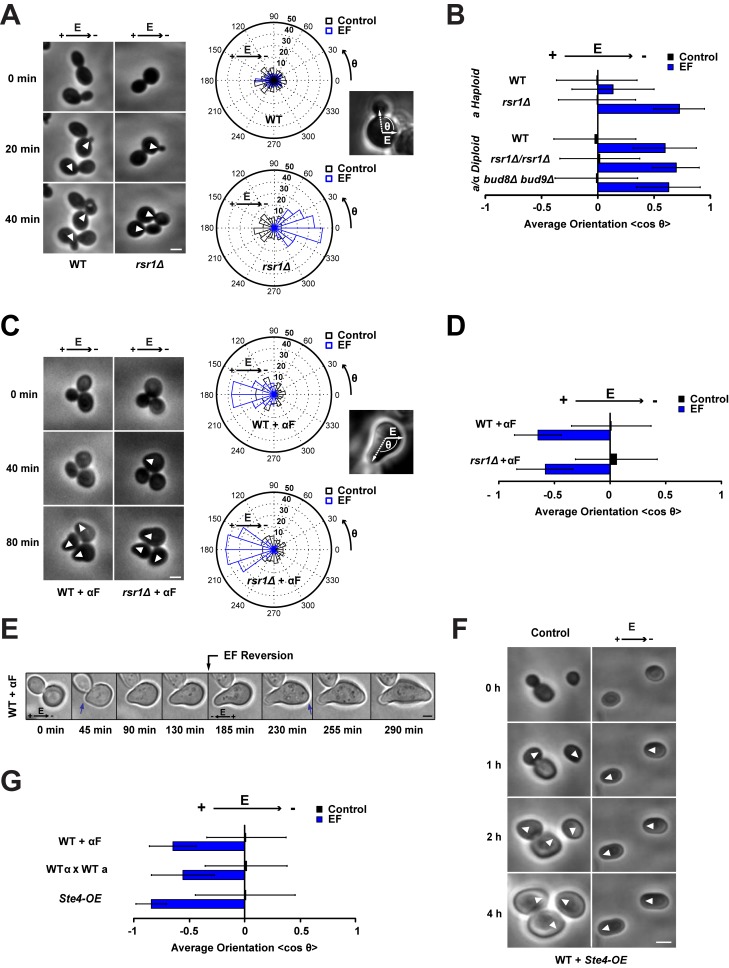
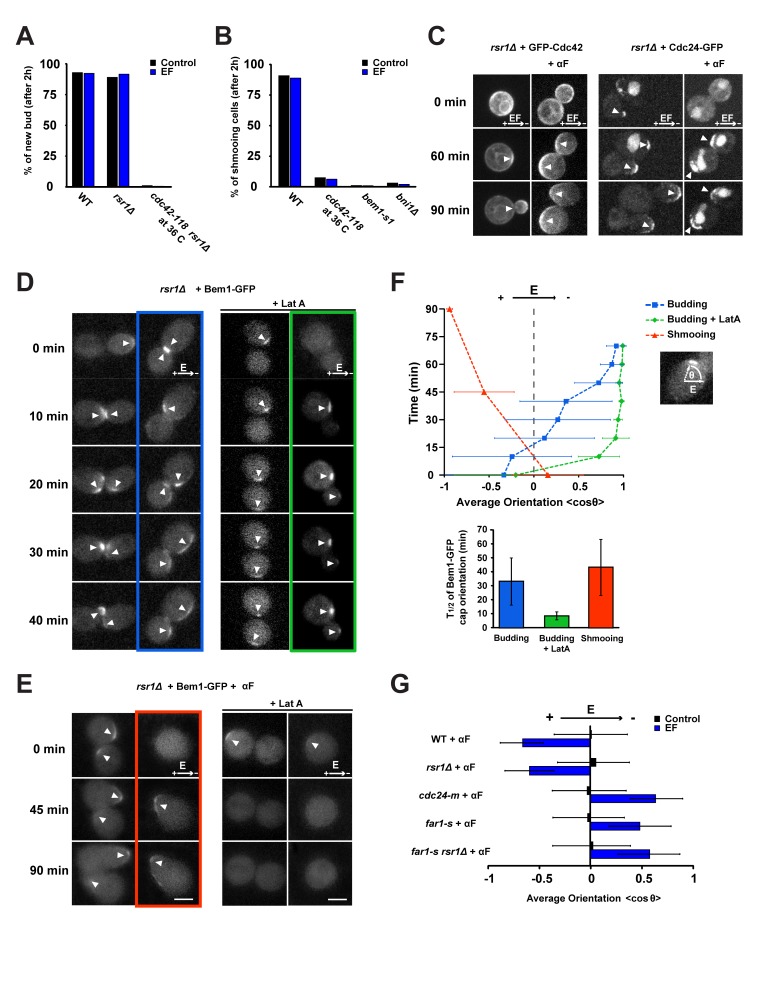
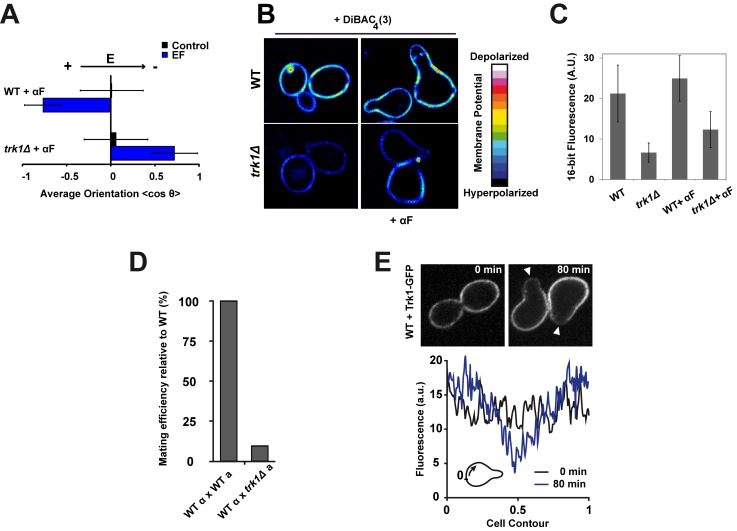
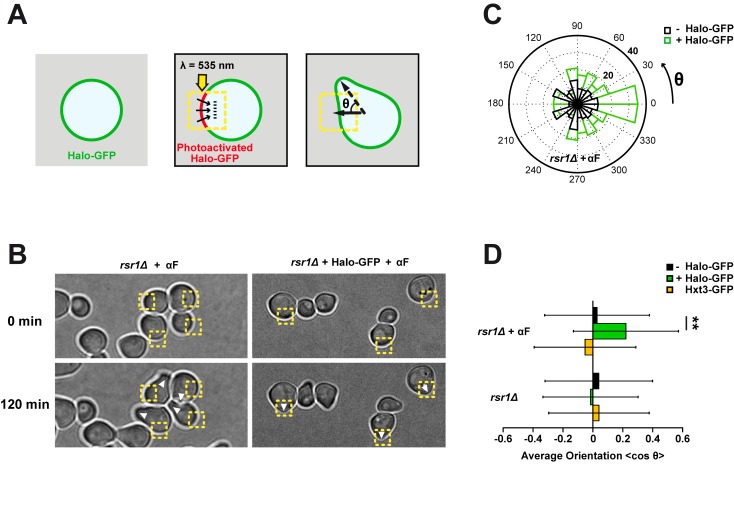
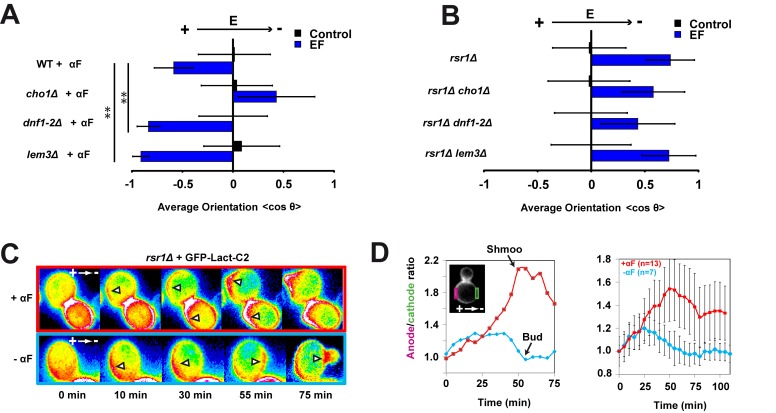
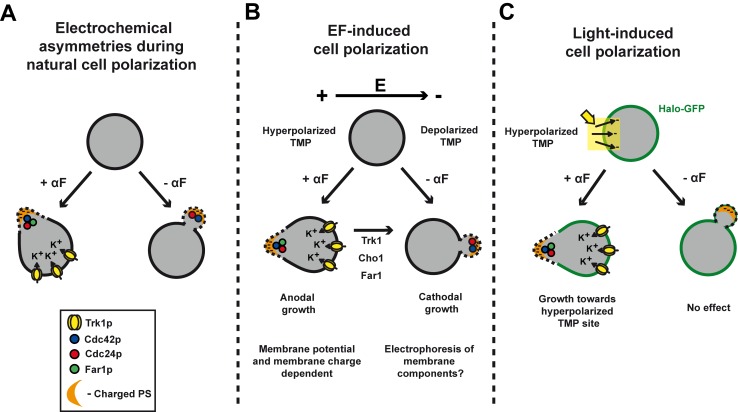
Cells are naturally surrounded by organized electrical signals in the form of local ion fluxes, membrane potential, and electric fields (EFs) at their surface. Although the contribution of electrochemical elements to cell polarity and migration is beginning to be appreciated, underlying mechanisms are not known. Here we show that an exogenous EF can orient cell polarization in budding yeast (Saccharomyces cerevisiae) cells, directing the growth of mating projections towards sites of hyperpolarized membrane potential, while directing bud emergence in the opposite direction, towards sites of depolarized potential. Using an optogenetic approach, we demonstrate that a local change in membrane potential triggered by light is sufficient to direct cell polarization. Screens for mutants with altered EF responses identify genes involved in transducing electrochemical signals to the polarity machinery. Membrane potential, which is regulated by the potassium transporter Trk1p, is required for polarity orientation during mating and EF response. Membrane potential may regulate membrane charges through negatively charged phosphatidylserines (PSs), which act to position the Cdc42p-based polarity machinery. These studies thus define an electrochemical pathway that directs the orientation of cell polarization.


Conflict of interest statement

The authors have declared that no competing interests exist.

Figures

Figure 1
Figure 1. Budding versus shmooing yeast cells polarize in opposite directions in an electric field.
(A) Phase contrast time lapse of WT and rsr1Δ budding yeast cells growing under an EF of 50 V/cm. White arrowheads point at sites of bud emergence. On the right are radial histograms of polarized growth direction (indicated as the final angle of bud emergence with the EF, θ) for WT and rsr1Δ cells in the presence or in the absence of an EF. (B) Average bud orientation, computed as <cosθ> after 3 h of growth in the absence or in the presence of an EF, for a population of haploids and diploids of the indicated genotype. A positive average orientation represents an orientation to the cathode (negative electrode of the EF), whereas a negative orientation stands for an orientation to the anode. (C) Phase contrast time lapse of WT and rsr1Δ budding yeast cells growing mating projections (“shmoos”) in the presence of α-factor (αF) under an EF of 50 V/cm. White arrowheads point at sites of shmoo emergence. On the right are radial histograms of polarized growth direction. (D) Average shmoo orientation after 3 h of mating tip growth in the absence or in the presence of an EF for a population of WT and rsr1Δ cells treated with α-factor. (E) Time-lapse images of shmoo reorientation in a WT cell after inverting the EF direction. A second shmoo is formed at the new anodal side after reversing the EF. Blue arrows indicate sites of shmoo emergence. (F) Time lapse of WT cells overexpressing Ste4p (Ste4-OE) in the absence or in the presence of an EF of 50 V/cm. White arrowheads point at sites of polarized growth. (G) Average shmoo orientation after 3 h in the absence or in the presence of an EF for a population of WT cells treated with α-factor, WT mating pairs, and WT cells overexpressing Ste4p. n>50 cells for all conditions. Error bars represent standard deviations. Scale bars: 2 µm.
Figure 2
Figure 2. EF response involves Cdc42p polarization.
(A) Percentage of new bud formation after 2 h in the absence or in the presence of an EF for a population of WT, rsr1Δ, and cdc42-118 rsr1Δ (at restrictive temperature, 36°C). (B) Percentage of shmoo formation after 2 h in the absence or in the presence of an EF for a population of WT, cdc42-118 (at restrictive temperature), bem1-s1, and bni1Δ cells treated with α-factor (αF). (C) Confocal single plane time-lapse images of GFP-Cdc42 and Cdc24-GFP expressed in rsr1Δ cells grown under an EF, in the absence or in the presence of α-factor. White arrowheads indicate the successive positions of the protein polar caps. (D) Confocal single plane time-lapse images of Bem1-GFP in control and LatA-treated rsr1Δ cells grown in the absence and in the presence of an EF. White arrowheads indicate the successive positions of Bem1-GFP polar caps. (E) Confocal single plane time-lapse images of Bem1-GFP in control and LatA-treated rsr1Δ cells grown with or without an EF in the presence of α-factor. Note that LatA treatment induces rapid dispersion of the Bem1-GFP signal at the cap, with or without EF. White arrowheads indicate the successive positions of Bem1-GFP polar caps. (F) Temporal evolution of the average orientation of Bem1-GFP caps with respect to the applied EF in a population of rsr1Δ cells, treated with and without LatA or α-factor (top) (n = 13 cells for budding [blue], n = 9 cells for budding + LatA [green], n = 4 cells for shmooing [red]). Half-time (t 1/2) corresponding to the mean orientation of Bem1-GFP polar caps to the cathode or anode of the EF is shown at the bottom. (G) Average shmoo orientation after 3 h in the absence or in the presence of an EF for a population of WT, rsr1Δ, cdc24-m, far1-s, and rsr1Δ far1-s cells treated with α-factor. n>50 cells for each condition. Error bars represent standard deviations. Scale bars: 2 µm.
Figure 3
Figure 3. A potassium transporter, Trk1p, mediates EF response in shmoos.
(A) Average shmoo orientation after 3 h in the absence or in the presence of an EF for a population of WT and trk1Δ cells treated with α-factor (αF) (n>50 cells). (B) Sixteen-color images of WT and trk1Δ cells stained with the membrane-potential-sensitive dye DiBAC4(3), which depicts reduced membrane fluorescence upon membrane hyperpolarization. (C) Quantification of DiBAC4(3) dye membrane staining intensity in WT and trk1Δ cells. (D) Mating efficiency of trk1Δ cells relative to WT. (E) Confocal single focal plane time-lapse images of Trk1-GFP in WT cells grown in the presence of α-factor. White arrowheads indicate shmoo growth sites. Below is the mean fluorescence intensity along the cell contour at times 0 and 80 min after α-factor treatment, averaged on five independent cells. Distances are normalized between 0 and 1 so that the value 0.5 corresponds to the site of shmoo emergence.
Figure 4
Figure 4. An optogenetic assay shows that asymmetries in membrane potential can direct polarity.
(A) Optogenetic assay to generate asymmetries in membrane potential and assess for effect on polarity. Schematic representation of the experimental setup: a yellow laser (λ = 535 nm) is used to photoactivate Halorhodopsin (Halo) in selected regions of rsr1Δ cells. θ is the final angle of shmoo or bud emergence with respect to the direction of the photoactivated region. (B) rsr1Δ (left) and Halorhodopsin-GFP-expressing rsr1Δ (right) cells in the presence of α-factor (αF) and retinal are continuously photoactivated from time 0 to 20 min at the indicated yellow region. After 2 h, shmoos grow and polarity orientation can be quantified with respect to the photoactivated region. White arrowheads indicate sites of shmoo formation. (C) Quantification of optogenetic experiments: radial histogram of polarized growth orientation with respect to photoactivation angle in rsr1Δ and rsr1Δ + Halorhodopsin-GFP cells treated with α-factor. (D) Average orientation of polarized growth in budding and shmooing cells after 2 h of growth following local photoactivation for a population of rsr1Δ, rsr1Δ Hxt3-GFP, and rsr1Δ + Halorhodopsin-GFP cells (n>70 cells gathered from four independent datasets for all conditions and n = 166 cells gathered from seven independent experiments for rsr1Δ + Halorhodopsin-GFP + α-factor). **Student's t test, p<0.05. Error bars represent standard deviations.
Figure 5
Figure 5. Membrane hyperpolarization orients polarity through local phosphatidylserine accumulation.
(A) Average shmoo orientation in the absence or presence of an EF for a population of WT, cho1Δ, dnf1-2Δ, and lem3Δ cells treated with α-factor (αF) (n>50 cells). (B) Average bud orientation after 3 h in the absence and in the presence of an EF for a population of rsr1Δ, rsr1Δ cho1Δ, rsr1Δ dnf1-2Δ, and rsr1Δ lem3Δ cells (n>50 cells). (C) Sixteen-color epifluorescence time lapses of shmooing and budding cells polarizing in EFs and expressing GFP-Lact-C2 probe (a marker for PS). White arrowheads point at sites of PS accumulation. (D) Quantification of PS localization in EFs. The ratio of anodal versus cathodal signal is computed by measuring the total amount at the membrane on both facing sides of the cell. Left: ratio evolution for the depicted sequences in (C). The black arrows indicate the moment when shmoo tip or bud was first visible. Right: average ratio of anodal versus cathodal PS signal for shmooing and budding cells. **Student's t test, p<0.001. Error bars represent standard deviations.
Figure 6
Figure 6. Influence of electrochemical asymmetries on polarity.
(A) During normal cell polarization, electrochemical layers segregate to the front and the back of the cell and may influence polarization processes, for instance during mating. (B) In an EF, the anode-facing side has hyperpolarized membrane potential, which drives anodal growth of the shmoos, in a Trk1-, Cho1-, and Far1-dependent manner. The secondary default orientation mode appears to be the cathodal orientation, which drives bud emergence and shmoo growth in trk1Δ, cho1Δ, and far1-s mutants by a yet unknown mechanism. (C) Optogenetic experiments directly suggest that local hyperpolarization of cell membrane potential can drive shmoo polarized growth but not bud site emergence. αF, α-factor.

References

    1. Drubin DG, Nelson WJ (1996) Origins of cell polarity. Cell 84: 335–344. - PubMed
    1. Campetelli A, Bonazzi D, Minc N (2012) Electrochemical regulation of cell polarity and the cytoskeleton. Cytoskeleton (Hoboken) 69: 601–612. - PubMed
    1. Schonichen A, Webb BA, Jacobson MP, Barber DL (2013) Considering protonation as a posttranslational modification regulating protein structure and function. Annu Rev Biophys 42: 289–314. - PMC - PubMed
    1. Simons M, Gault WJ, Gotthardt D, Rohatgi R, Klein TJ, et al. (2009) Electrochemical cues regulate assembly of the Frizzled/Dishevelled complex at the plasma membrane during planar epithelial polarization. Nat Cell Biol 11: 286–294. - PMC - PubMed
    1. Magalhaes MA, Larson DR, Mader CC, Bravo-Cordero JJ, Gil-Henn H, et al. (2011) Cortactin phosphorylation regulates cell invasion through a pH-dependent pathway. J Cell Biol 195: 903–920. - PMC - PubMed

Publication types

MeSH terms

Substances