

Image derived input function for [18F]-FEPPA: application to quantify translocator protein (18 kDa) in the human brain
- PMID: 25549260
- PMCID: PMC4280118
- DOI: 10.1371/journal.pone.0115768
Image derived input function for [18F]-FEPPA: application to quantify translocator protein (18 kDa) in the human brain
Abstract
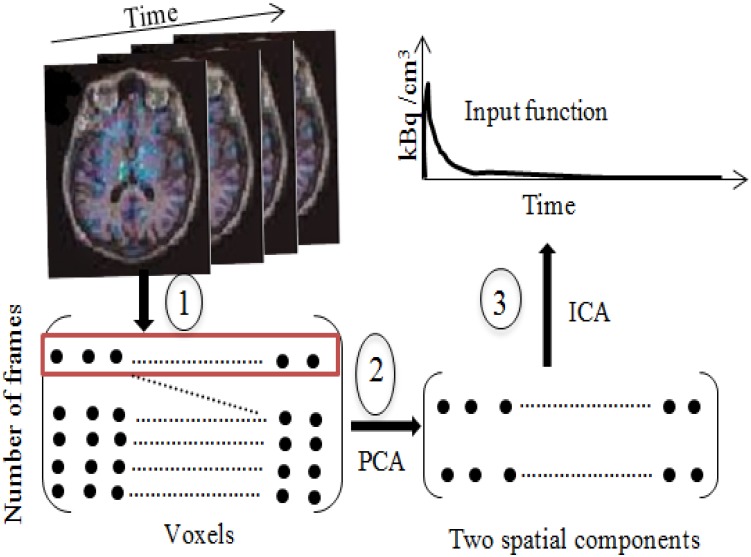
In [18F]-FEPPA positron emission topography (PET) imaging, automatic blood sampling system (ABSS) is currently the gold standard to obtain the blood time activity curve (TAC) required to extract the input function (IF). Here, we compare the performance of two image-based methods of IF extraction to the ABSS gold standard method for the quantification of translocator protein (TSPO) in the human brain. The IFs were obtained from a direct delineation of the internal carotid signal (CS) and a new concept of independent component analysis (ICA). PET scans were obtained from 18 healthy volunteers. The estimated total distribution volume (V(T)) by CS-IF and ICA-IF were compared to the reference V(T) obtained by ABSS-IF in the frontal and temporal cortex, cerebellum, striatum and thalamus regions. The V(T) values estimated using ICA-IF were more reliable than CS-IF for all brain regions. Specifically, the slope regression in the frontal cortex with ICA-IF was r² = 0.91 (p<0.05), and r² = 0.71 (p<0.05) using CS-IF.
Conflict of interest statement
Figures


 and
and  , with the exception of one subject for
  .
.

Similar articles
-
Feasibility study of TSPO quantification with [18F]FEPPA using population-based input function.PLoS One. 2017 May 17;12(5):e0177785. doi: 10.1371/journal.pone.0177785. eCollection 2017. PLoS One. 2017. PMID: 28545084 Free PMC article.
-
Optimized Quantification of Translocator Protein Radioligand ¹⁸F-DPA-714 Uptake in the Brain of Genotyped Healthy Volunteers.J Nucl Med. 2015 Jul;56(7):1048-54. doi: 10.2967/jnumed.115.156083. Epub 2015 May 29. J Nucl Med. 2015. PMID: 26025960
-
Quantitative imaging of neuroinflammation in human white matter: a positron emission tomography study with translocator protein 18 kDa radioligand, [18F]-FEPPA.Synapse. 2014 Nov;68(11):536-47. doi: 10.1002/syn.21765. Epub 2014 Jul 28. Synapse. 2014. PMID: 25043159 Free PMC article.
-
Translocator protein (18 kDa) polymorphism (rs6971) explains in-vivo brain binding affinity of the PET radioligand [(18)F]-FEPPA.J Cereb Blood Flow Metab. 2012 Jun;32(6):968-72. doi: 10.1038/jcbfm.2012.46. Epub 2012 Apr 4. J Cereb Blood Flow Metab. 2012. PMID: 22472607 Free PMC article. Clinical Trial.
-
GABA levels and TSPO expression in people at clinical high risk for psychosis and healthy volunteers: a PET-MRS study.J Psychiatry Neurosci. 2019 Mar 1;44(2):111-119. doi: 10.1503/jpn.170201. J Psychiatry Neurosci. 2019. PMID: 30255837 Free PMC article.
Cited by
-
Application of positron emission tomography in psychiatry-methodological developments and future directions.Transl Psychiatry. 2022 Jun 14;12(1):248. doi: 10.1038/s41398-022-01990-2. Transl Psychiatry. 2022. PMID: 35701411 Free PMC article. Review.
-
Non-invasive kinetic modelling approaches for quantitative analysis of brain PET studies.Eur J Nucl Med Mol Imaging. 2023 May;50(6):1636-1650. doi: 10.1007/s00259-022-06057-4. Epub 2023 Jan 18. Eur J Nucl Med Mol Imaging. 2023. PMID: 36651951 Free PMC article.
-
Development of a minimally invasive simultaneous estimation method for quantifying translocator protein binding with [18F]FEPPA positron emission tomography.EJNMMI Res. 2023 Jan 12;13(1):1. doi: 10.1186/s13550-023-00950-1. EJNMMI Res. 2023. PMID: 36633702 Free PMC article.
-
Image Quantification for TSPO PET with a Novel Image-Derived Input Function Method.Diagnostics (Basel). 2022 May 7;12(5):1161. doi: 10.3390/diagnostics12051161. Diagnostics (Basel). 2022. PMID: 35626315 Free PMC article.
-
Feasibility study of TSPO quantification with [18F]FEPPA using population-based input function.PLoS One. 2017 May 17;12(5):e0177785. doi: 10.1371/journal.pone.0177785. eCollection 2017. PLoS One. 2017. PMID: 28545084 Free PMC article.
References
-
- Ouchi Y, Yoshikawa E, Sekine Y, Futatsubashi M, Kanno T, et al. (2005) Microglial Activation and Dopamine Terminal Loss in Early Parkinson’s Disease. Ann Neurol 57:168–175. - PubMed
-
- Gerhard A, Pavese N, Hotton G, Turkheimer F, Es M, et al. (2006) In vivo imaging of microglial activation with [11C](R)-PK11195 PET in idiopathic Parkinson’s disease. Neurobiology of Disease 21:404–412. - PubMed
Publication types
MeSH terms
Substances
Grants and funding
LinkOut - more resources
Full Text Sources
Other Literature Sources
Miscellaneous
