

Hyperspectral imaging for mapping of total nitrogen spatial distribution in pepper plant
- PMID: 25549353
- PMCID: PMC4280196
- DOI: 10.1371/journal.pone.0116205
Hyperspectral imaging for mapping of total nitrogen spatial distribution in pepper plant
Erratum in
-
Correction: Hyperspectral Imaging for Mapping of Total Nitrogen Spatial Distribution in Pepper Plant.PLoS One. 2015 Jul 24;10(7):e0134071. doi: 10.1371/journal.pone.0134071. eCollection 2015. PLoS One. 2015. PMID: 26208284 Free PMC article. No abstract available.
Abstract
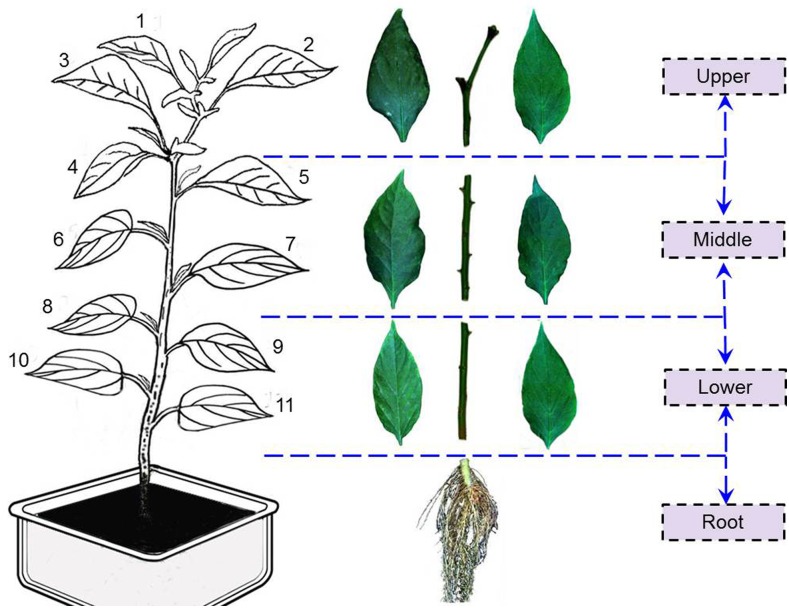
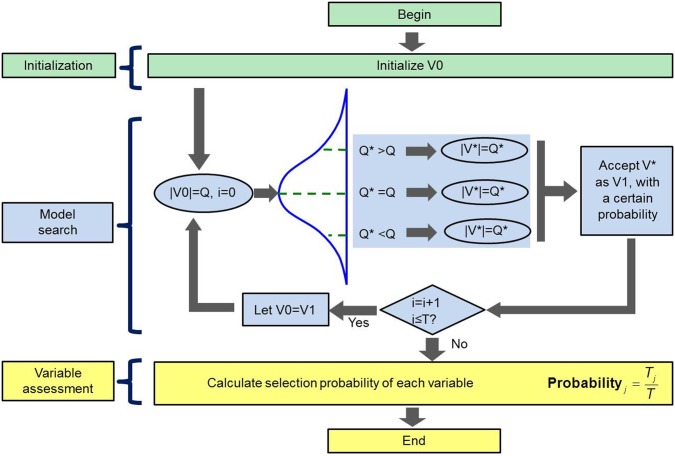
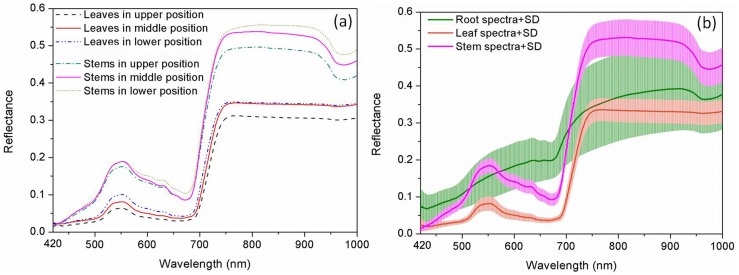
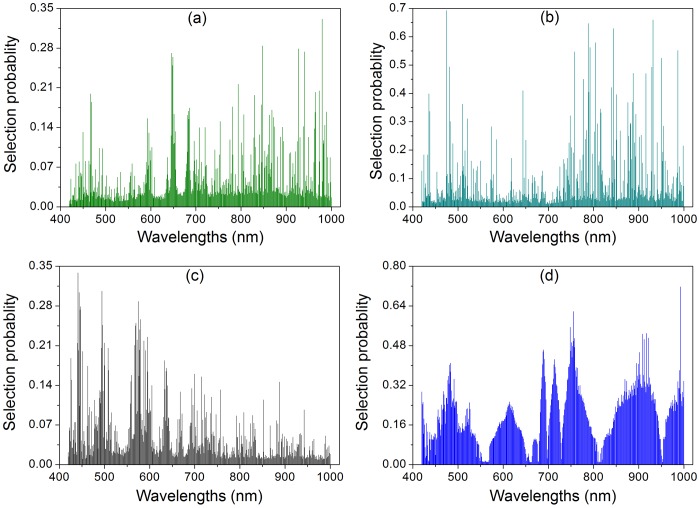
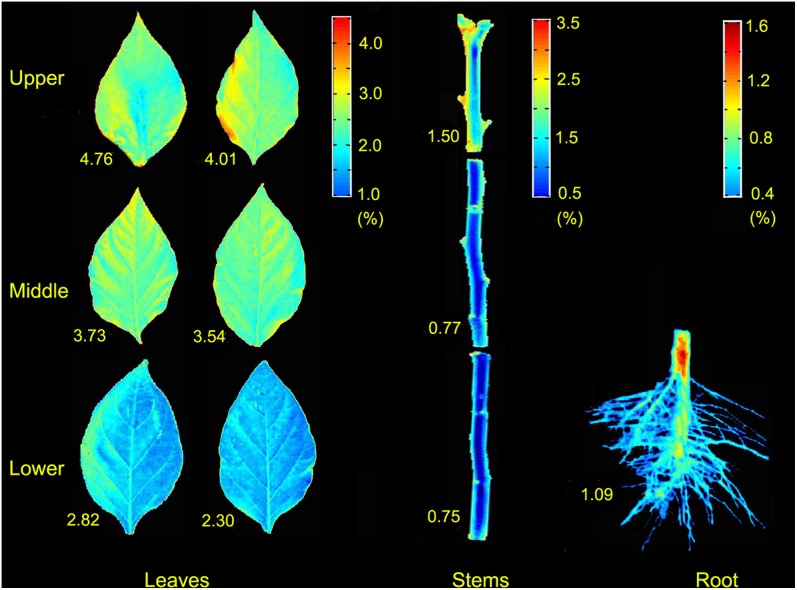
Visible/near-infrared (Vis/NIR) hyperspectral imaging was employed to determine the spatial distribution of total nitrogen in pepper plant. Hyperspectral images of samples (leaves, stems, and roots of pepper plants) were acquired and their total nitrogen contents (TNCs) were measured using Dumas combustion method. Mean spectra of all samples were extracted from regions of interest (ROIs) in hyperspectral images. Random frog (RF) algorithm was implemented to select important wavelengths which carried effective information for predicting the TNCs in leaf, stem, root, and whole-plant (leaf-stem-root), respectively. Based on full spectra and the selected important wavelengths, the quantitative relationships between spectral data and the corresponding TNCs in organs (leaf, stem, and root) and whole-plant (leaf-stem-root) were separately developed using partial least-squares regression (PLSR). As a result, the PLSR model built by the important wavelengths for predicting TNCs in whole-plant (leaf-stem-root) offered a promising result of correlation coefficient (R) for prediction (RP = 0.876) and root mean square error (RMSE) for prediction (RMSEP = 0.426%). Finally, the TNC of each pixel within ROI of the sample was estimated to generate the spatial distribution map of TNC in pepper plant. The achievements of the research indicated that hyperspectral imaging is promising and presents a powerful potential to determine nitrogen contents spatial distribution in pepper plant.
Conflict of interest statement
Figures
References
-
- Johnson CD, Decoteau DR (1996) Nitrogen and potassium fertility affects jalapeño pepper plant growth, pod yield, and pungency. HortScience 31:1119–1123.
-
- Bosland PW (1992) Chiles: a diverse crop. HortTechnology 2:6–10.
-
- FAOSTAT (2001) Crop water information: pepper. FAO Water Development and Management Unit. Available: http://www.fao.org/nr/water/cropinfo_pepper. html.
-
- Feng L, Fang H, Zhou WJ, He Y (2006) Nitrogen stress measurement of canola based on multi-spectral charged coupled device imaging sensor. Spectroscopy and Spectral Analysis 26:1749–1752. - PubMed
-
- Van Hezewijk BH, De Clerck-Floate RA, Moyer JR (2008) Effect of nitrogen on the preference and performance of a biological control agent for an invasive plant. Biological Control 46:332–340.
Publication types
MeSH terms
Substances
LinkOut - more resources
Full Text Sources
Other Literature Sources
Research Materials
Miscellaneous
