. 2015 Mar 15:242:127-40.
doi: 10.1016/j.jneumeth.2014.12.016. Epub 2014 Dec 27.

SWDreader: a wavelet-based algorithm using spectral phase to characterize spike-wave morphological variation in genetic models of absence epilepsy

Affiliations

SWDreader: a wavelet-based algorithm using spectral phase to characterize spike-wave morphological variation in genetic models of absence epilepsy

C D Richard et al. J Neurosci Methods. .

Abstract

Background: Spike-wave discharges (SWD) found in neuroelectrical recordings are pathognomonic to absence epilepsy. The characteristic spike-wave morphology of the spike-wave complex (SWC) constituents of SWDs can be mathematically described by a subset of possible spectral power and phase values. Morlet wavelet transform (MWT) generates time-frequency representations well-suited to identifying this SWC-associated subset.

New method: MWT decompositions of SWDs reveal spectral power concentrated at harmonic frequencies. The phase relationships underlying SWC morphology were identified by calculating the differences between phase values at SWD fundamental frequency from the 2nd, 3rd, and 4th harmonics, then using the three phase differences as coordinates to generate a density distribution in a {360°×360°×360°} phase difference space. Strain-specific density distributions were generated from SWDs of mice carrying the Gria4, Gabrg2, or Scn8a mutations to determine whether SWC morphological variants reliably mapped to the same regions of the distribution, and if distribution values could be used to detect SWD.

Comparison with existing methods: To the best of our knowledge, this algorithm is the first to employ spectral phase to quantify SWC morphology, making it possible to computationally distinguish SWC morphological subtypes and detect SWDs.

Results/conclusions: Proof-of-concept testing of the SWDfinder algorithm shows: (1) a major pattern of variation in SWC morphology maps to one axis of the phase difference distribution, (2) variability between the strain-specific distributions reflects differences in the proportions of SWC subtypes generated during SWD, and (3) regularities in the spectral power and phase profiles of SWCs can be used to detect waveforms possessing SWC-like morphology.

Keywords: Absence epilepsy; Fundamental frequency; Harmonic analysis; Morlet wavelet transform; Morphology; Mouse mutant; Phase differences; Seizure detection algorithm; Spike-wave complex; Spike-wave discharge.


Figures

Figure 1
Figure 1. Effect of harmonic power and phase on signal morphology
Five signal reconstructions illustrate the independent effects of spectral power and phase on shape using s(t)=h=14(Ahcos(2πhf0t+ϕh)) where f0 = 1/T0 is the fundamental frequency, Ah is the power at harmonic h, hf0 is the harmonic frequency and ϕh is the phase of the harmonic h. (A) Pure spike morphology (A1=1, A2=1, A3=1, A4=1; ϕ1=0°, ϕ2=0°, ϕ3=0°, ϕ4=0°) (B) Pure wave morphology (A1=1, A2=1, A3=1, A4=1; ϕ1=0°, ϕ2=180°, ϕ3=0°, ϕ4=180°) (C) Comparisons are relative to representative spike-wave complex (SWC) depicted in panel C.2 (A1=600, A2=800, A3=550, A4=240; ϕ1=0°, ϕ2=45°, ϕ3=90°, ϕ4=135°). (C.1) Signal reconstruction with harmonic power identical to the representative SWC, but by changing phase relationships the morphology deviates considerably from spike-wave shape (ϕ1=0°, ϕ2=18°, ϕ3=196°, ϕ4=174°). (C.3) Signal reconstruction has identical phase relationships as representative SWC, but different power at the four harmonic frequencies (A1=110, A2=190, A3=1120, A4=570).
Figure 2
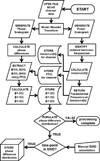
Figure 2. Flowchart outlining ECoG processing steps performed by SWDreader
(see Section 2.4 for details)
Figure 3
Figure 3. Identification of putative harmonic frequencies and harmonicity magnitude
(A) Results of analysis for a representative ECoG trace. All four panels are aligned to the same time scale. (A.1) ECoG trace from the RF-RB channel of the FeJ.HeJ-Gria4spkw1 mouse 29725. Trace containing five SWDs within a ~2.5 minute window of recording drawn midway through the 2 hour session. (A.2) Time-frequency profile of spectral power (power scalogram) generated by MWT for ECoG trace. Lighter regions indicate higher power. Harmonics plainly visible as roughly horizontal bands. (A.3) Fundamental frequency estimates resulting from harmonic filter cross-covariance method. Boxes bound temporal regions identified as SWDs in manual annotation. (A.4) Harmonicity magnitudes as reflected in the maximum cross-covariance, max(XCOV), across time. Horizontal line represents the mean harmonicity for entire two hours, and is used as a threshold to identify the initial set of PSRs. (B.1) Close up of a ~2 second section near the start of the SWD marked by gray box in A.1. (B.2) Power scalogram associated with ECoG section. (C.1) Instantaneous power spectrum from time point in power scalogram marked by the red arrow in B.2. Putative harmonics are identified in each time point by performing a cross-covariance operation between instantaneous power spectrum and (C.2) a harmonic filter. (C.3) Results of cross-covariance. The fundamental frequency of putative harmonics, regardless of whether or not harmonics are present, is determined by the frequency at which the max(XCOV) is calculated. Since cross-covariance values are greater at frequencies where the harmonic filter is aligned with local peaks positioned at harmonic frequencies in the spectrum, the magnitude of max(XCOV) is used as a measure of the harmonicity for that time point.
Figure 4
Figure 4. Generation of phase difference distribution
The three left panels share same range of time points. (A) Section of ECoG containing part of a SWD (same one depicted in Figure 2B.1) from RF-RB channel of a FeJ.HeJ-Gria4spkw1 mouse. (B) Time-frequency profile of MWT phase for ECoG section. At each time point, phase values are extracted from the corresponding four putative harmonic frequencies (white lines) identified in the cross-covariance step. Dark-to-light edges in phase scalogram correspond to 359° to 0° boundaries between adjacent periods. (C) Phase differences between the fundamental frequency (1st harmonic) and the 2nd1:2), 3rd1:3), and 4th1:4) harmonics. (D) Phase difference trajectory of partial SWD depicted in ECoG section through 3-D phase difference space. Trajectory is color coded to match ECoG trace in panel (A). Phase difference coordinates {ϕ1:2 ϕ1:3 ϕ1:4} of the SWD trajectory start at {72°, 133°, 166°} and continue through coordinates of each successive time point to terminate at {84°, 155°, 204°}.
Figure 5
Figure 5. Phase difference distributions
ECoG recordings from one of the two sessions of each FeJ.HeJ-Gria4spkw1 mouse were selected at random to generate a frequency distribution for use in SWDreader scoring. (A) The distribution represents occurrence counts for all phase differences falling within manually annotated SWDs of FeJ.HeJ-Gria4spkw1 (replicate 1) from all 6 ECoG channels. The resulting distribution formed a flattened scalene ellipsoid, approximately 6π from end to end, wrapping around at three orthogonal cube faces. The highest counts appearing along its major axis (values increase from black-to-white). ImageJ software was used to apply a 3D Gaussian blur (σ=5°) to raw distribution to fill any empty spaces adjacent to high value coordinates. Distribution viewed from the left, top and right faces of cube shown in the three top panels. (B) Phase difference distributions by strain. Density values represented along rainbow color spectrum with highest values at red end and lowest values at blue end of spectrum. Cube orientations are identical to facilitate comparison. Coordinates {ϕ1:2 ϕ1:3 ϕ1:4} where maximum density values were found differed by strain. FeJ.HeJ-Gria4spkw1 (replicate 1) {130°, 257°, 13°}; FeJ-Gria4spkw1 {31°, 67°, 106°}; FeJ-Gabrg2tmSpet {163°, 294°, 66°}; FeJ-Scn8a8J {134°, 255°, 3°}.
Figure 6
Figure 6. SWC morphological variants extracted from different regions of phase difference distribution
Manually annotated (real) SWCs with trajectories passing through maximum density regions (±10° around coordinates of strain maxima) of each respective strain’s phase difference distribution. Shorter durations represent higher frequencies (Hz), and longer durations represent lower frequencies. (A) Phase distribution space with replicate 1 distribution (in gray) used as reference. Cubic regions for “pure spike”, “pure wave” and maximum density are color-matched to data shown in panels B–D. (B) Traces of extracted SWCs based on the regions their trajectories passed through “pure spike” region {0°±10°, 0°±10°, 0°±10°} and “pure wave” region {180°±10°, 0°±10°, 180°±10°}, (C) the strain-specific maximum density regions for FeJ-Gria4spkw1/spkw1 {31°±10°, 67°±10°, 106°±10°}, FeJ-Scn8a8J/+ {134°±10°, 255°±10°, 3°±10°}, and FeJ-Gabrg2R43Q/+ {163°±10°, 294°±10°, 66°±10°}. (D) Strain-specific SWC percentages at each cubic region.
Figure 7
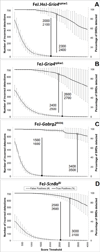
Figure 7. Threshold curves of SWDreader seizure detection performance by strain
Strain averages for the number of correct SWD and incorrect SWD detections (±S.D.) at 40 score thresholds are plotted above. Thresholds where performance criterion were met are marked with unfilled circles (score at which 90% of SWDs were detected, thresholdTPR≥90%) and filled circles (score at which 10 or less incorrect detections were made, thresholdFP≤10). (A) FeJ.HeJ-Gria4spkw1 mice (replicate 2), at thresholdFP≤10 (2000–2100), percentage of correct SWD detections: 94.2% (±9.4%) – 95.0% (±8.7%), number of incorrect SWD detections: 9.5±6.0 −11.6±6.9; at thresholdTPR≥90% (2300–2400), percentage of correct SWD detections: 89.2%(±11.9%) – 91.5% (±9.8%), number of incorrect SWD detections: 6.3±4.7 – 7.0±4.6 (B) FeJ-Gria4spkw1/spkw1 mice, at thresholdFP≤10 (2600–2700), percentage of correct SWD detections: 87.0% (±17.1%) – 88.1% (±15.4%), number of incorrect SWD detections: 9.1±4.8 −10.5±5.6; at threshold TPR≥90% (2400–2500), percentage of correct SWD detections: 89.1% (±14.4%) – 91.1% (±13.2%), number of incorrect SWD detections: 12.0±5.4 – 14.1±5.6 (C) FeJ-Gabrg2R43Q/+ mice, at thresholdFP≤10 (1500–1600), percentage of correct SWD detections: 98.8% (±1.5%) – 99.2% (±1.2%), number of incorrect SWD detections: 9.9±4.8 – 11.6±6.0; at thresholdTPR≥90% (3400–3500), percentage of correct SWD detections: 89.4% (±12.1%) −90.3% (±11.5%), number of incorrect SWD detections: 0.7±0.7 – 0.8±0.6 (D) FeJ-Scn8a8J/+ mice, at thresholdFP≤10 (2500–2600), percentage of correct SWD detections: 93.7% (±5.6%) −94.6% (±5.0%), number of incorrect SWD detections: 9.3±3.8 – 10.4±4.1; at thresholdTPR≥90% (3000 – 3100), percentage of correct SWD detections: 88.8% (±12.1%) −90.3% (±11.5%), number of incorrect SWD detections: 5.6±3.2 – 6.3±3.3.

References

    1. Akman O, Demiralp T, Ates N, Onat FY. Electroencephalographic differences between WAG/Rij and GAERS rat models of absence epilepsy. Epilepsy Research. 2010;89(2–3):185–193. - PubMed
    1. Arneodo A, Audit B, Decoster N, Muzy JF, Vaillant C. The Science of Disasters: Climate Disruptions, Heart Attacks, and Market Crashes. Berlin: Springer; 2002. Wavelet based multifractal formalism: Applications to DNA sequences, satellite images of the cloud structure, and stock market data; pp. 27–96.
    1. Arneodo A, Vaillant C, Audit B, Argoul F, d’Aubenton-Carafa Y, Thermes C. Multi-scale coding of genomic information: From DNA sequence to genome structure and function. Physics Reports. 2011;498(2–3):45–188.
    1. Audit B, Bacry E, Muzy J-F, Arneodo A. Wavelet-based estimators of scaling behavior. IEEE Transactions on Information Theory. 2002;48(11):2938–2954.
    1. Audit B, Baker A, Chen C-L, Rappailles A, Guilbaud G, Julienne H, Goldar A, D’Aubenton-Carafa Y, Hyrien O, Thermes C, Arneodo A. Multiscale analysis of genome-wide replication timing profiles using a wavelet-based signal-processing algorithm. Nature Protocols. 2013;8(1):98–110. - PubMed

Publication types

LinkOut - more resources