. 2014 Dec;26(12):4782-801.
doi: 10.1105/tpc.114.131607. Epub 2014 Dec 30.

Soybean miR172c targets the repressive AP2 transcription factor NNC1 to activate ENOD40 expression and regulate nodule initiation

Affiliations

Soybean miR172c targets the repressive AP2 transcription factor NNC1 to activate ENOD40 expression and regulate nodule initiation

Youning Wang et al. Plant Cell. 2014 Dec.

Abstract

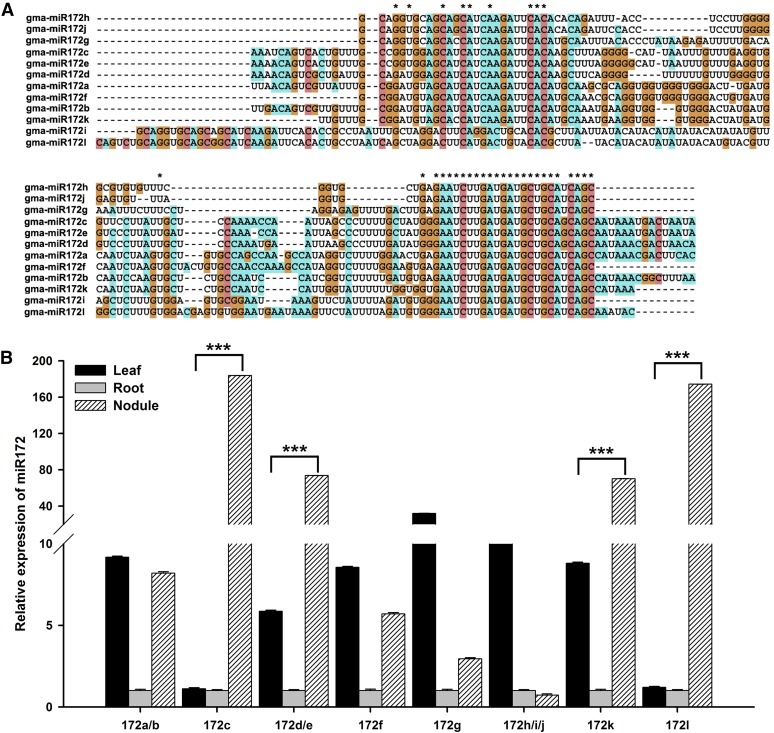
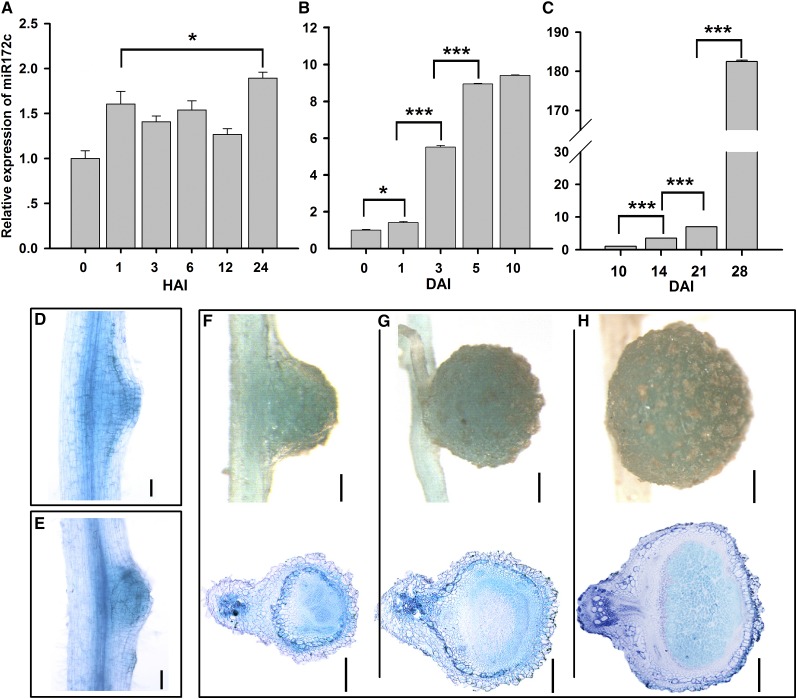
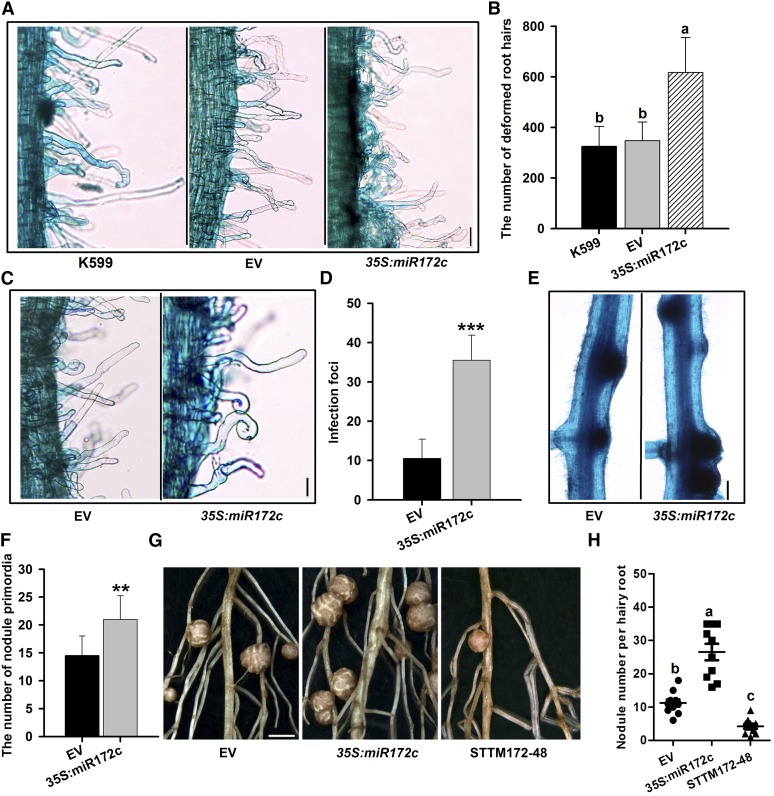
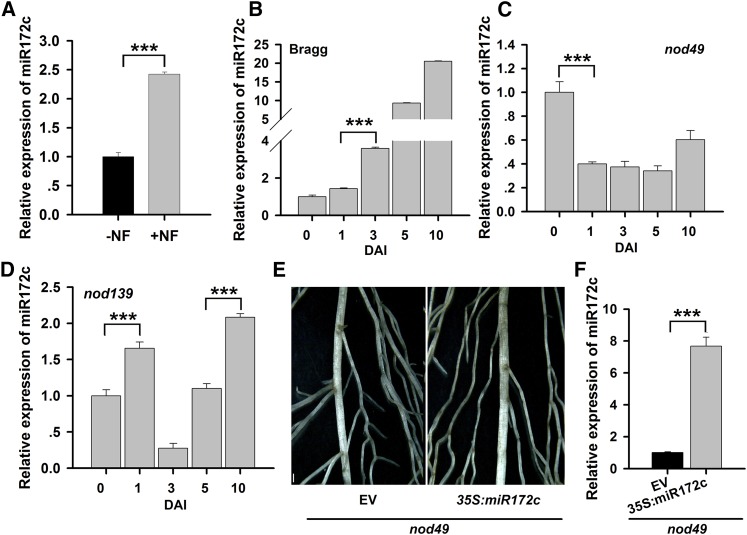
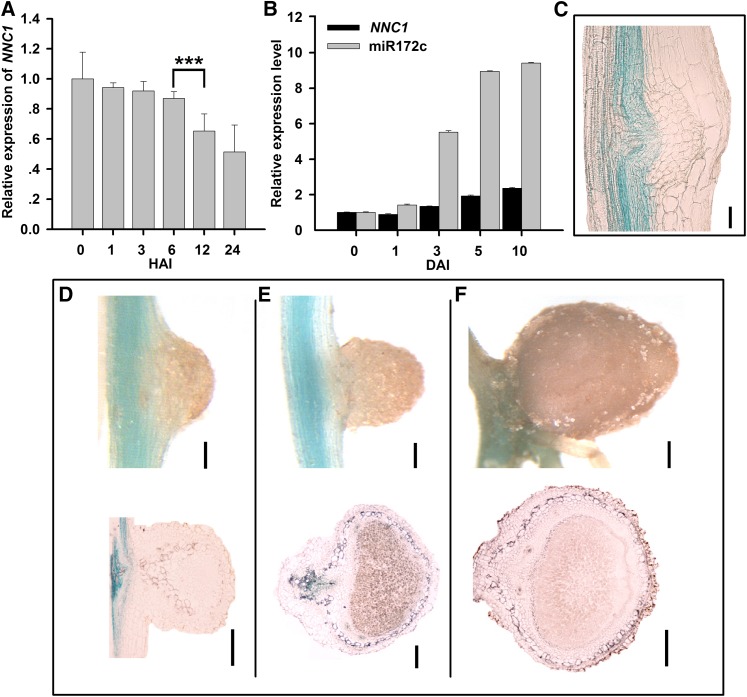
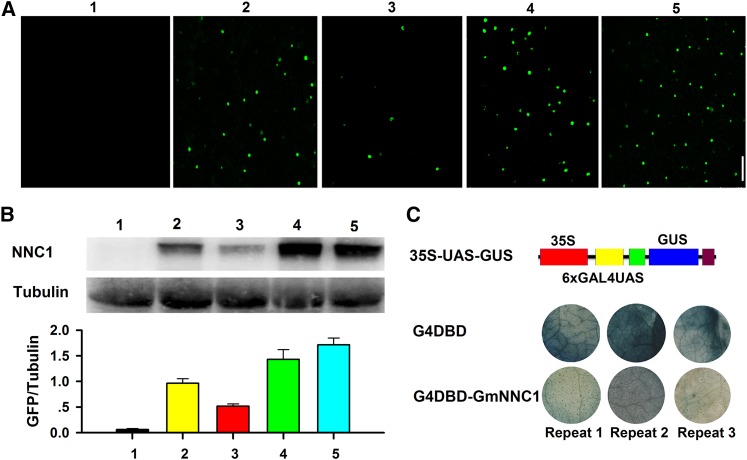
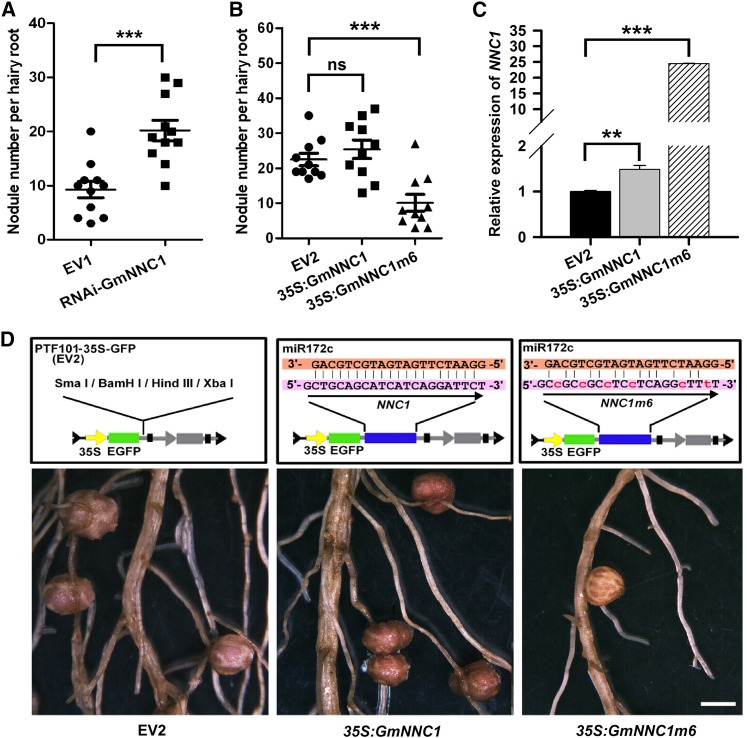
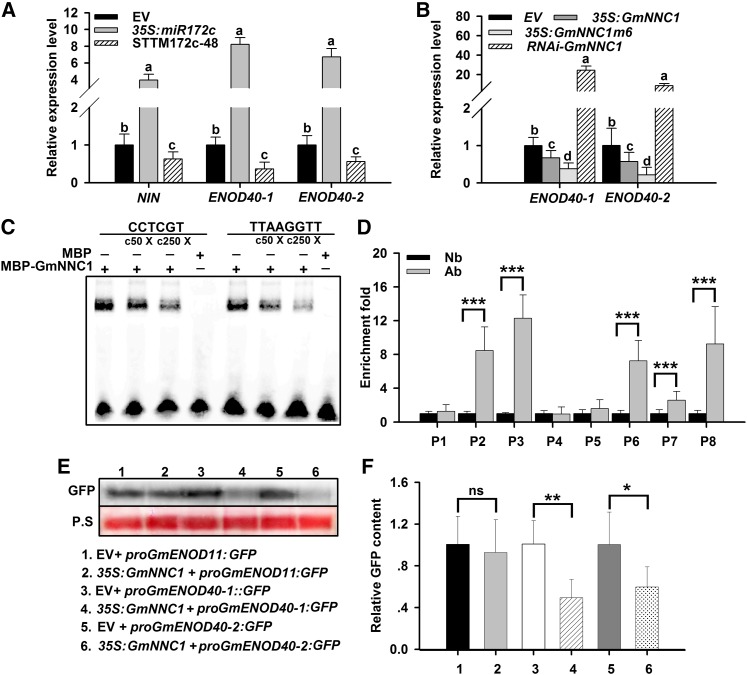
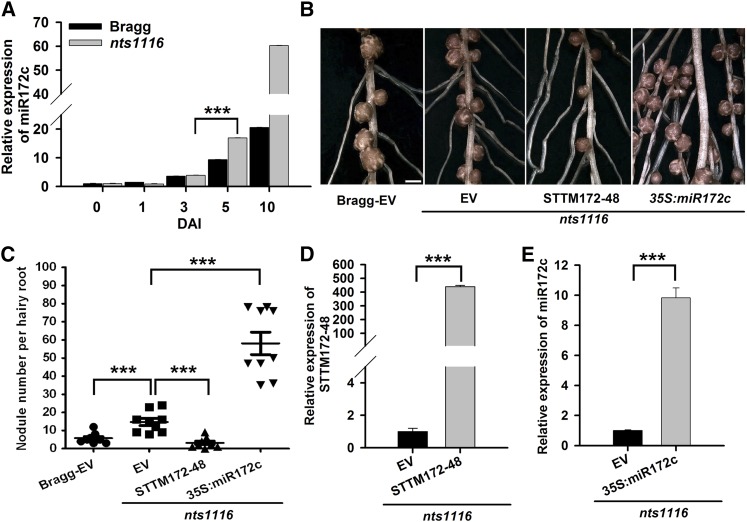
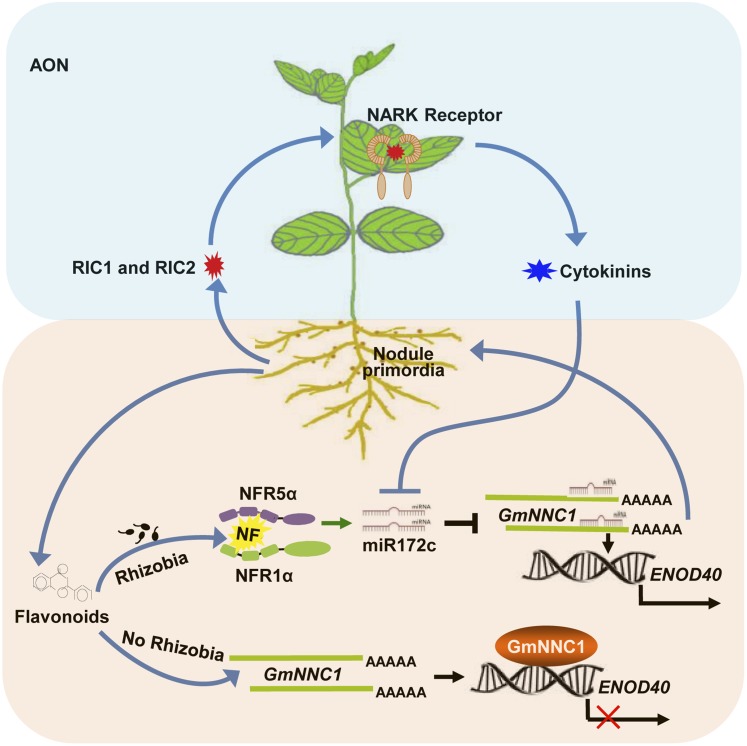
MicroRNAs are noncoding RNAs that act as master regulators to modulate various biological processes by posttranscriptionally repressing their target genes. Repression of their target mRNA(s) can modulate signaling cascades and subsequent cellular events. Recently, a role for miR172 in soybean (Glycine max) nodulation has been described; however, the molecular mechanism through which miR172 acts to regulate nodulation has yet to be explored. Here, we demonstrate that soybean miR172c modulates both rhizobium infection and nodule organogenesis. miR172c was induced in soybean roots inoculated with either compatible Bradyrhizobium japonicum or lipooligosaccharide Nod factor and was highly upregulated during nodule development. Reduced activity and overexpression of miR172c caused dramatic changes in nodule initiation and nodule number. We show that soybean miR172c regulates nodule formation by repressing its target gene, Nodule Number Control1, which encodes a protein that directly targets the promoter of the early nodulin gene, ENOD40. Interestingly, transcriptional levels of miR172c were regulated by both Nod Factor Receptor1α/5α-mediated activation and by autoregulation of nodulation-mediated inhibition. Thus, we established a direct link between miR172c and the Nod factor signaling pathway in addition to adding a new layer to the precise nodulation regulation mechanism of soybean.


Figures

Figure 1.
Figure 1.
Sequence Alignments and Tissue-Specific Expression Analysis of miR172 Family Members. (A) Pre-miRNA sequence alignment of miR172 family members. All sequences of the miR172 family members were aligned using the software MEGA5. Asterisks represent conserved nucleotides in all pre-miRNAs. (B) Tissue-specific expression analysis of miR172 family members. Seven-day-old seedlings were inoculated with B. japonicum strain USDA110. Leaves, roots, and nodules were harvested at 28 DAI (n = 5). Transcript abundance in the different samples was normalized to that of miR1520d. Expression levels are shown as means ± se from three replicates. Asterisks indicate statistically significant differences (***P < 0.001, Student’s t test). [See online article for color version of this figure.]
Figure 2.
Figure 2.
The Expression Pattern of miR172c. (A) and (B) qRT-PCR relative expression of miR172c in roots. Seven-day-old seedlings were inoculated with B. japonicum strain USDA110, and roots were harvested at 0, 1, 3, 6, 12, and 24 h after inoculation (HAI) (A) or 0, 1, 3, 5, and 10 DAI (B) (n = 5). miR1520d was used as an endogenous control for gene expression. Expression levels are shown as means ± se from three replicates. Asterisks represent statistically significant differences (Student’s t test, ***P < 0.001, *P < 0.05). (C) qRT-PCR of miR172c in nodules. Seven-day-old seedlings were inoculated with B. japonicum strain USDA110, and nodules were harvested at 10, 14, 21, and 28 DAI. Asterisks represent statistically significant differences (Student’s t test, ***P < 0.001). (D) and (E) miR172c histochemical analysis of promiR172c:GUS during nodule initiation. Bars = 200 μm. (F) to (H) GUS staining of promiR172c:GUS in 10-d-old (F), 14-d-old (G), and 28-d-old (H) nodules. Bars in (F) = 100 μm; bars in (G) = 250 μm; bars in (H) = 400 μm.
Figure 3.
Figure 3.
Effect of the Overexpression or Knockdown of miR172c on Nodulation. (A) to (C) Overexpression of miR172c increased the number of deformed root hairs. At 6 DAI, 2-cm root segments of hairy roots overexpressing miR172c below the root-hypocotyl junction were cut and stained with 1% (w/v) methylene blue. Considerably deformed root hairs were counted (n = 10 to 12). (A) Root hair deformation in transgenic roots harboring empty vector (EV) and 35S:miR172c vector. Bar = 40 μm. (B) Quantification of deformed root hairs in the transgenic lines (n = 10 to 12). Values are averages ± sd from three independent experiments. Different letters indicate a significant difference (Student-Newman-Kuels test, P < 0.05). (C) Highly magnified view of deformed root hairs in the roots transformed with empty and 35S:miR172c vectors. Bar = 40 μm. (D) The number of infection foci observed in transgenic roots overexpressing miR172c (n = 10 to 12). Asterisks indicate statistically significant differences (Student’s t test, ***P < 0.001). Values are averages ± sd from three independent experiments. (E) Nodule primordia of individual hairy roots expressing the empty vector and 35S:miR172c at 6 DAI. Bar = 400 μm. (F) The number of nodule primordia in roots transformed with empty and 35S:miR172c vectors (n = 10 to 12). Values are averages ± sd from three independent experiments. Asterisks represent statistically significant differences (Student’s t test, **P < 0.01). (G) Nodules of individual hairy roots expressing the empty vector, 35S:miR172c, and STTM172-48 at 28 DAI. Bar = 3 mm. (H) Quantitative analysis of the nodule number per hairy root expressing empty vector, 35S:miR172c, and STTM172-48 (n = 10 to 12). Values are averages ± sd from three independent experiments. Different letters indicate a significant difference (Student-Newman-Kuels test, P < 0.05).
Figure 4.
Figure 4.
The Function of miR172c in Regulating Nodule Development Is Dependent on NFRs. (A) qRT-PCR analysis of miR172c in response to NF treatment. Four-day-old seedlings were treated with distilled, deionized water (−NF) or 10−8 M B. japonicum NF (+NF), and the roots were collected at 3 DAI (n = 5). (B) to (D) qRT-PCR analysis of miR172c expression in wild-type cv Bragg (B) and its isogenic nonnodulation mutants nod49 (C) and nod139 (D), which harbor mutations in NFR1α and NFR5α, respectively (n = 5). Seven-day-old seedlings were inoculated with B. japonicum strain USDA110. The roots were harvested at 0, 1, 3, 5, and 10 DAI. (E) Image of hairy roots from the NFR1α mutant nod49 expressing empty vector (EV) or 35S:miR172c at 28 DAI. Bar = 700 μm. (F) qRT-PCR analysis of miR172c expression in transgenic roots of the NFR1α mutant nod49 expressing 35S:miR172c (n = 5). For all gene expression results shown, miR1520d was used as an internal control. Expression levels are shown as means ± se from three replicates. Asterisks represent statistically significant differences (Student’s t test, ***P < 0.001). [See online article for color version of this figure.]
Figure 5.
Figure 5.
The Expression Pattern of the miR172c Target Gene NNC1. (A) and (B) qRT-PCR of NNC1 in roots at various times after B. japonicum inoculation during early infection (A) and nodule development (B) (n = 5). Transcript levels were normalized to the expression of GmELF1b in each sample. Expression levels are shown as means ± se from three replicates. Asterisks represent statistically significant differences (Student’s t test, ***P < 0.001). HAI, h after inoculation. (C) Expression of proGmNNC1:GUS at the nodule initiation stage at 10 DAI. Bar = 50 μm. (D) to (F) Expression of proGmNNC1:GUS in developing nodules at 10 (D), 14 (E), or 28 (F) DAI. Bars in (D) = 100 μm; bars in (E) = 300 μm; bars in (F) = and 400 μm.
Figure 6.
Figure 6.
Experimental Validation of NNC1 as a Target Gene of miR172c and Transcriptional Activity Analysis. (A) and (B) Analysis of the cleavage of NNC1 by miR172c. The indicated constructs were transformed or cotransformed into N. benthamiana leaves, and the expression of NNC1 was imaged (A). Experiments were performed three times. Immunoblot analysis using antibody against GFP and relative GmNNC1-GFP accumulation in the different agroinfiltration assays are indicated in bar graphs below each panel (B). Experiments were performed three times. Different numbers indicate (as follows): 1, 35S:miR172c; 2, 35S:GmNNC1-GFP; 3, 35S:GmNNC1-GFP + 35S:miR172c; 4, 35S:GmNNC1m6-GFP; 5, 35S:GmNNC1m6-GFP + 35S:miR172c. (C) Transcriptional activity of Gm-NNC1 was tested in N. benthamiana leaves using a GAL4/UAS-based system. 35S, the 35S promoter without the TATA box; 6×GAL4 UAS, six copies of the GAL4 binding site (UAS); G4DBD, the GAL4 DNA binding domain; G4DBD-GmNNC1, G4DBD fused with Gm-NNC1. Experiments were performed three times, and each experiment contained at least three replicates.
Figure 7.
Figure 7.
miR172c Regulates Soybean Nodule Numbers through Direct Inhibition of Its Target Gene NNC1. (A) and (B) Nodule numbers per hairy root transformed with empty vector (EV1, pTCK303) or RNAi-GmNNC1 (A) or 35S:GmNNC1 and 35S:GmNNC1m6 (B) at 28 DAI (n = 10 to 12). Experiments were performed three times. Values are averages ± sd. Asterisks represent statistically significant differences (Student’s t test, ***P < 0.001; ns, not significant at P > 0.05). (C) qRT-PCR analysis of GmNNC1 in roots transformed with empty vector and constructs harboring 35S:GmNNC1 and 35S:GmNNC1m6 (n = 10 to 12). ELF1b was used as an endogenous control for gene expression. Asterisks represent statistically significant differences (Student’s t test, ***P < 0.001, **P < 0.05). (D) Nodules of representative roots overexpressing NNC1, NNC1m6, or GFP (EV2; control) at 28 DAI. Bar = 3 mm. [See online article for color version of this figure.]
Figure 8.
Figure 8.
NNC1 Directly Targets the Promoters of ENOD40 Genes. (A) qRT-PCR analysis of NIN and ENOD40-1 and -2 in roots transformed with empty vector (EV), 35S:miR172c, or STTM172-48 at 28 DAI (n = 10 to 12). Transcript amounts in each sample were normalized to those of ELF1b. Expression levels shown are means ± se from three replicates. Different letters indicate a significant difference (Student-Newman-Kuels test, P < 0.05). (B) qRT-PCR analysis of ENOD40 genes in roots transformed with empty vector, 35S:GmNNC1, 35S:GmNNC1m6, or RNAi-GmNNC1 at 28 DAI (n = 10 to 12). Transcript amounts in each sample were normalized to those of ELF1b. Expression levels are means ± se from three replicates. Different letters indicate a significant difference (Student-Newman-Kuels test, P < 0.05). (C) EMSA showing that MBP-GmNNC1 binds to the CCTCGT and TTAAGGTT motifs of the ENOD40 promoters in vitro following incubation. Competition for binding was performed using 50× (c50×) and 250× (c250×) competitive ENOD40 probes; MBP was used as a negative control. Three biological replications were performed. (D) ChIP assay for binding NNC1 to the ENOD40 promoters. The sequence regions marked by P1 to P8 indicate regions examined in the ChIP assays. ELF1b was employed as an internal control for expression. Three biological replications were performed. Each value is the average ± sd from three independent experiments. Asterisks represent statistically significant differences (Student’s t test, ***P < 0.001). Ab, antibody for fragment; Nb, no antibody for fragment. (E) and (F) Repression of ENOD40 genes by NNC1. Constructs harboring proGmENOD40:GFP were transformed with 35S:GmNNC1 into N. benthamiana leaves. ENOD40 expression was analyzed by immunoblot (E), and GFP intensity was measured by fluorospectrophotometer (F). P.S, Ponceau S-stained gel representing equal loading. Nine independent plants were assessed. The experiment was repeated three times and always exhibited a similar trend. ENOD11 was used as a negative control. Each value is the average ± sd from three independent experiments. Asterisks represent statistically significant differences (Student’s t test, **P < 0.01, *P < 0.05; ns, not significant at P > 0.05). [See online article for color version of this figure.]
Figure 9.
Figure 9.
The Function of miR172c in Regulating Nodule Development Is Negatively Regulated by NARK. (A) qRT-PCR analysis of miR172c in wild-type cv Bragg and its isogenic nodulation mutant nts1116, which carries a mutation in NARK (n = 10 to 12). miR1520d was used as an internal control for gene expression. Expression levels shown are means ± se from three replicates. (B) Nodules from hairy roots of nts1116 mutant plants expressing empty vector (EV), STTM172-48, or 35S:miR172c at 28 DAI. Bar = 700 μm. (C) Quantitative analysis of the nodule number per hairy root of nts1116 mutant plants expressing empty vector, STTM172-48, and 35S:miR172c (n = 10 to 12). Nodule number per hairy root of wild-type cv Bragg plants expressing the empty vector was used as a control. Each value is the average ± sd from three independent experiments. Asterisks represent statistically significant differences (Student’s t test, ***P < 0.001). (D) qRT-PCR analysis of STTM172-48 in transgenic hairy roots of nts1116 mutant plants (n = 10 to 12). The y axis indicates the expression levels of the gene relative to the expression of ELF1b. Expression levels are means ± se from three replicates. Asterisks represent statistically significant differences (Student’s t test, ***P < 0.001) (E) qRT-PCR analysis of miR172c in transgenic hairy roots of nts1116 mutant plants. The expression levels were normalized against the geometric mean of miR1520d. Expression levels are means ± se from three replicates. Asterisks represent statistically significant differences (Student’s t test, ***P < 0.001). [See online article for color version of this figure.]
Figure 10.
Figure 10.
A Proposed Model of the miR172c-NNC1-Mediated Regulation of Nodule Formation and Nodule Number Control in Soybean. When rhizobia are absent, NNC1 represses ENOD40 gene transcription via promoter binding. In the presence of rhizobia, NFRs recognize NFs and induce signaling that upregulates miR172c, which targets and cleaves NNC1 mRNAs. The resulting decrease in NNC1 transcript releases the inhibition of ENOD40 expression, leading to ENOD40 activation and ultimately to nodule organogenesis. Nodule overproduction is prevented by AON signaling, in which short CLE peptides (RIC1 and RIC2) activate NARK. NARK, which is found on the plasma membrane of leaf phloem parenchyma cells, induces shoot-derived cytokinins that, in turn, repress the transcriptional activity of miR172c and thereby promote nodulation.

References

    1. Aukerman M.J., Sakai H. (2003). Regulation of flowering time and floral organ identity by a microRNA and its APETALA2-like target genes. Plant Cell 15: 2730–2741. - PMC - PubMed
    1. Banfalvi Z., Nieuwkoop A., Schell M., Besl L., Stacey G. (1988). Regulation of nod gene expression in Bradyrhizobium japonicum. Mol. Gen. Genet. 214: 420–424. - PubMed
    1. Bazin J., Bustos-Sanmamed P., Hartmann C., Lelandais-Brière C., Crespi M. (2012). Complexity of miRNA-dependent regulation in root symbiosis. Philos. Trans. R. Soc. Lond. B Biol. Sci. 367: 1570–1579. - PMC - PubMed
    1. Broghammer A., et al. (2012). Legume receptors perceive the rhizobial lipochitin oligosaccharide signal molecules by direct binding. Proc. Natl. Acad. Sci. USA 109: 13859–13864. - PMC - PubMed
    1. Bustos-Sanmamed P., Mao G., Deng Y., Elouet M., Khan G.A., Bazin J., Lelandais-Brière C. (2013). Overexpression of miR160 affects root growth and nitrogen-fixing nodule number in Medicago truncatula. Funct. Plant Biol. 40: 1208–1220. - PubMed

Publication types

MeSH terms