. 2015 Feb 27;290(9):5647-60.
doi: 10.1074/jbc.M114.618249. Epub 2014 Dec 30.

Transmission of atherosclerosis susceptibility with gut microbial transplantation

Affiliations

Transmission of atherosclerosis susceptibility with gut microbial transplantation

Jill C Gregory et al. J Biol Chem. .

Abstract

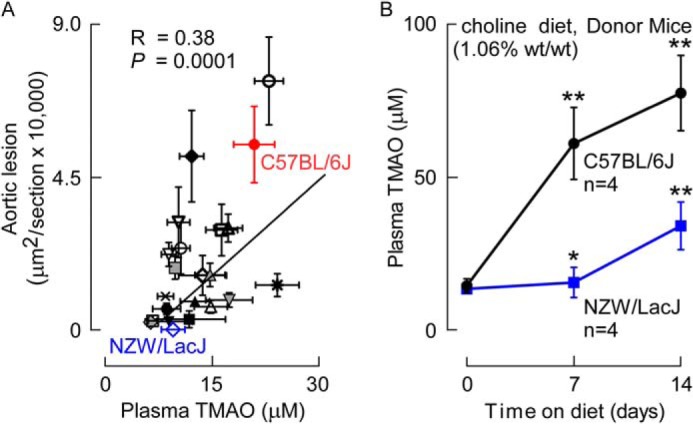
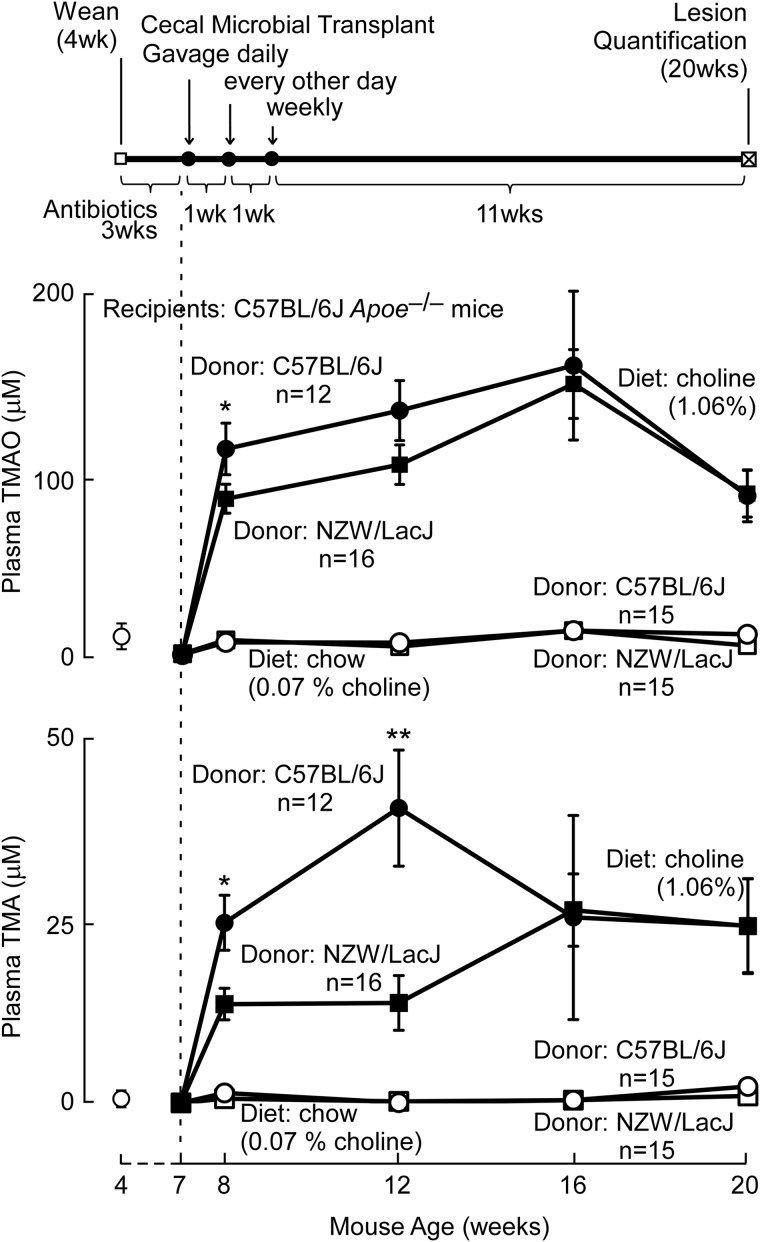
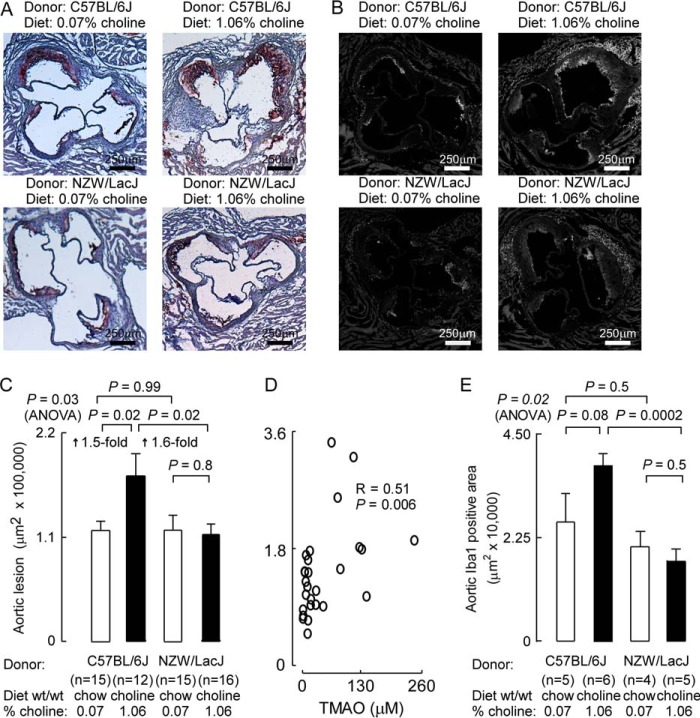
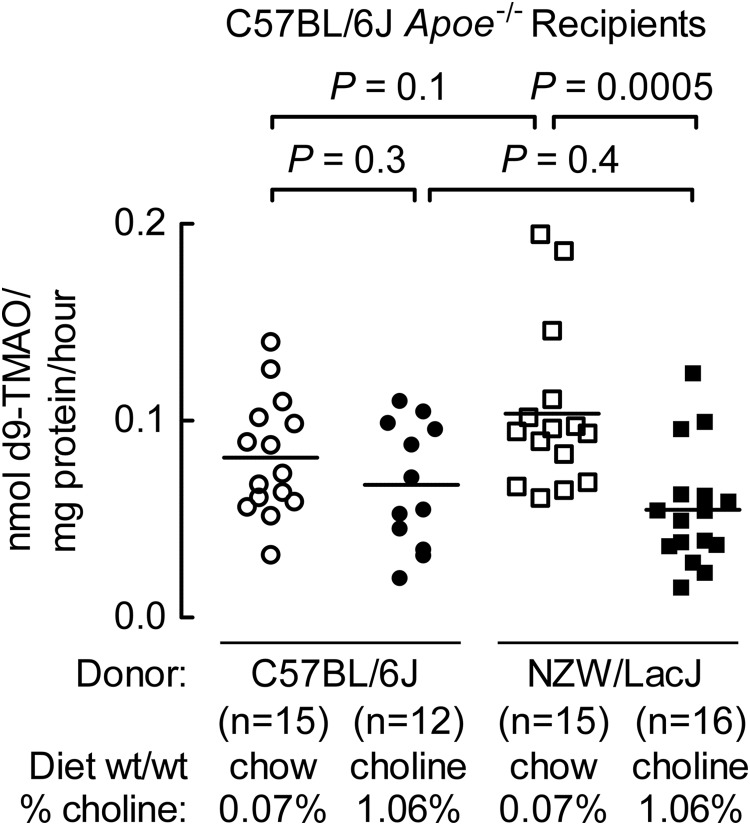
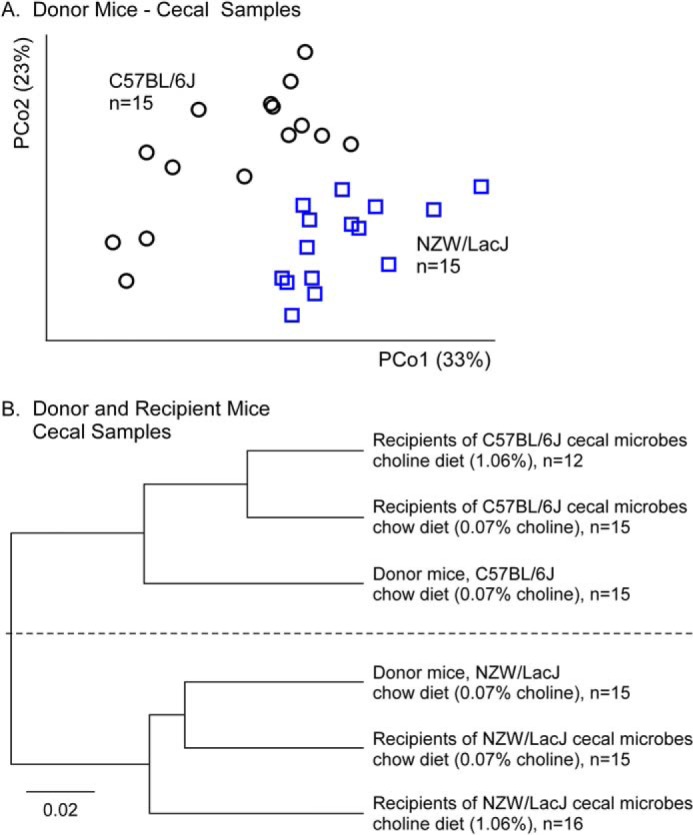
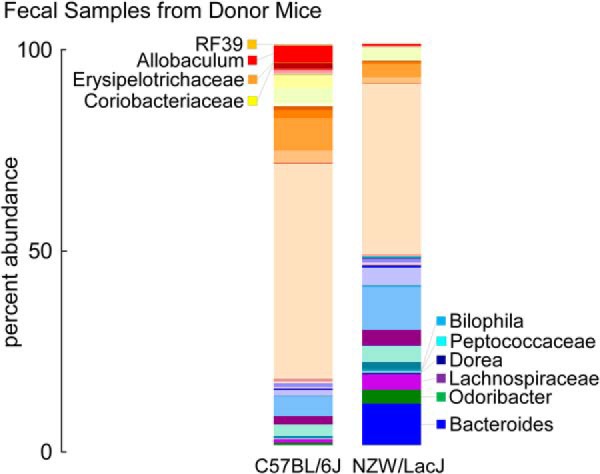
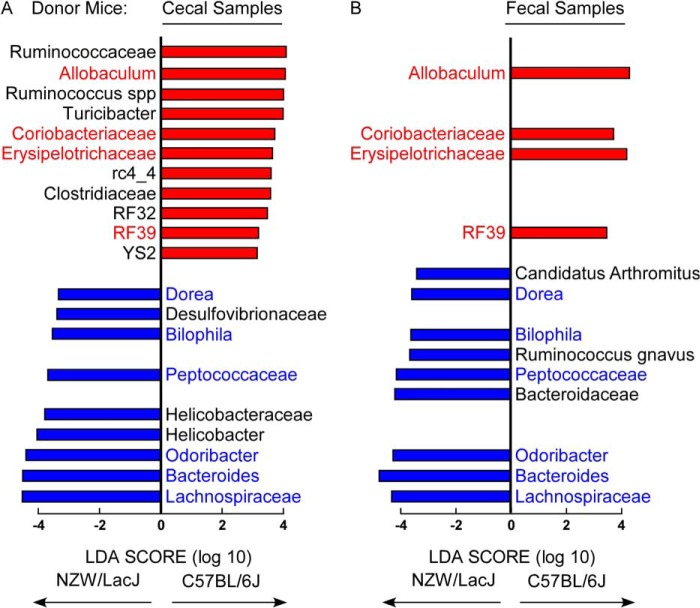
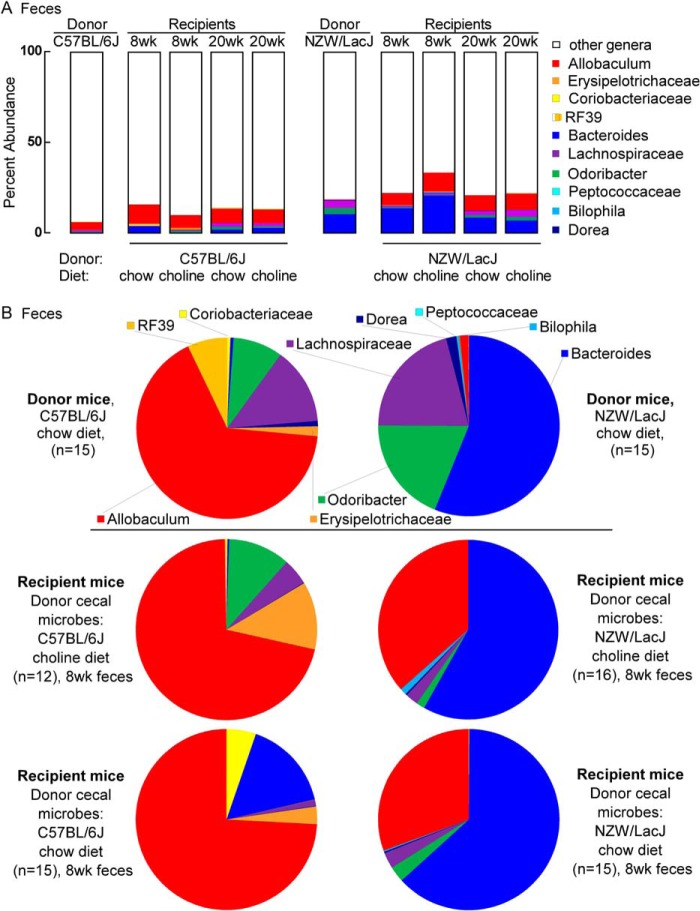
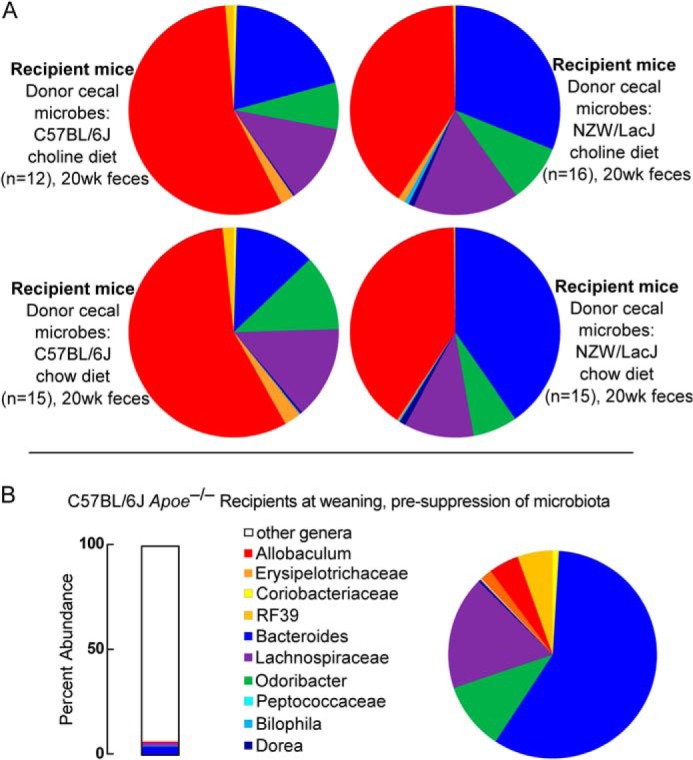
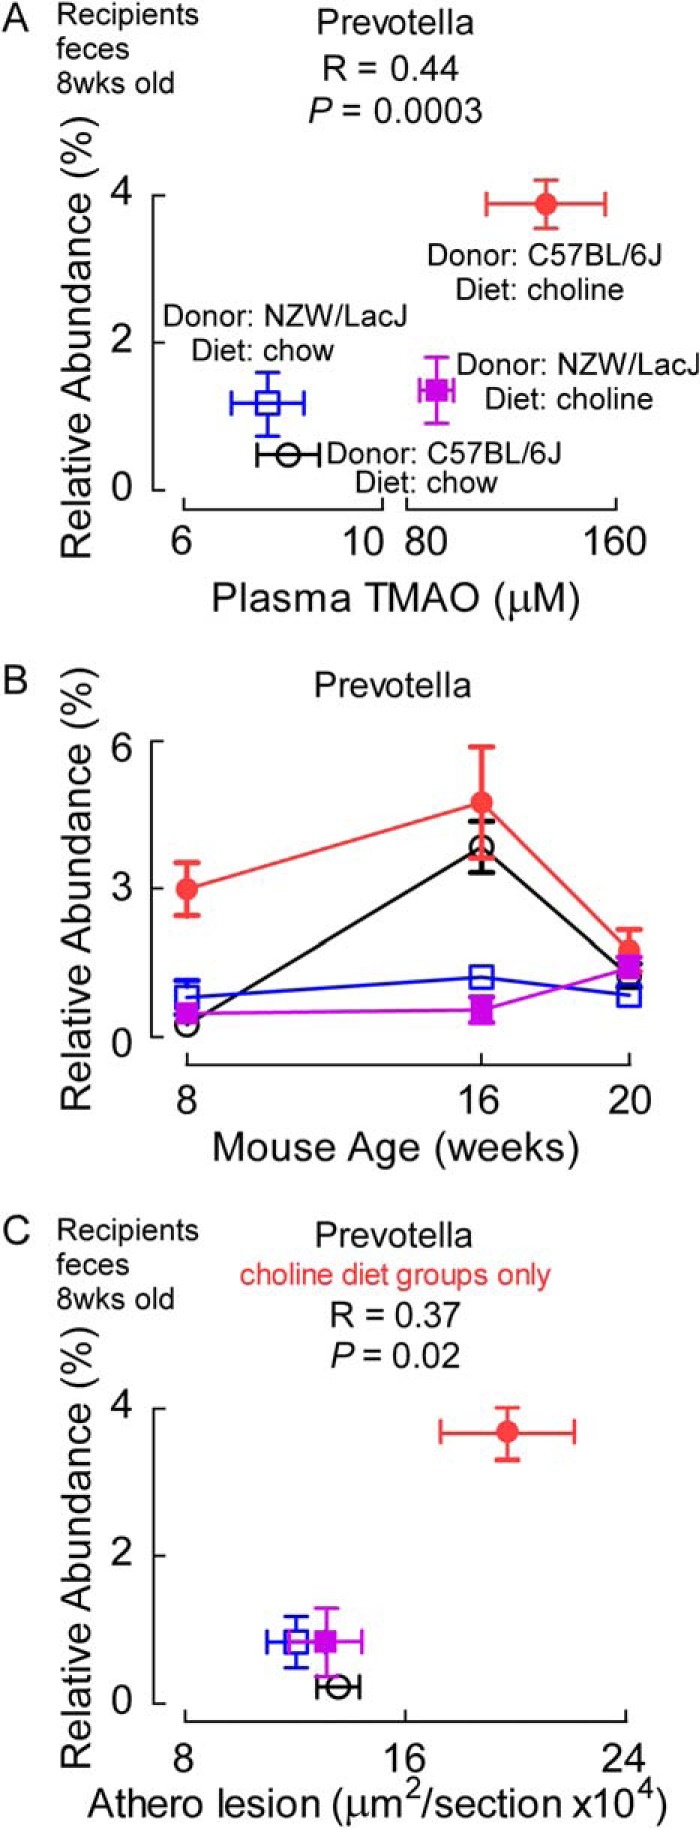
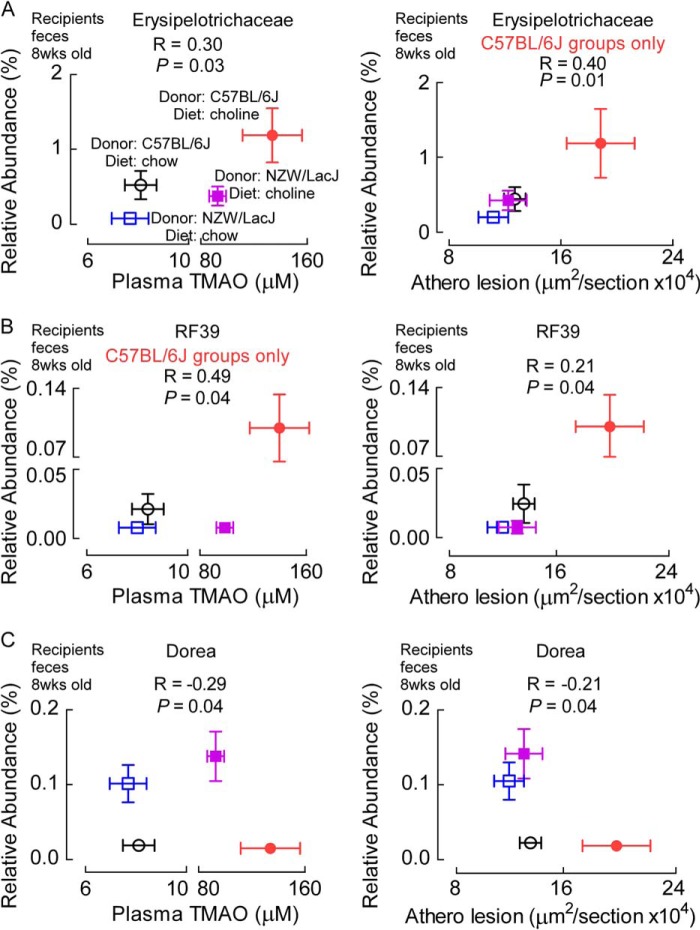
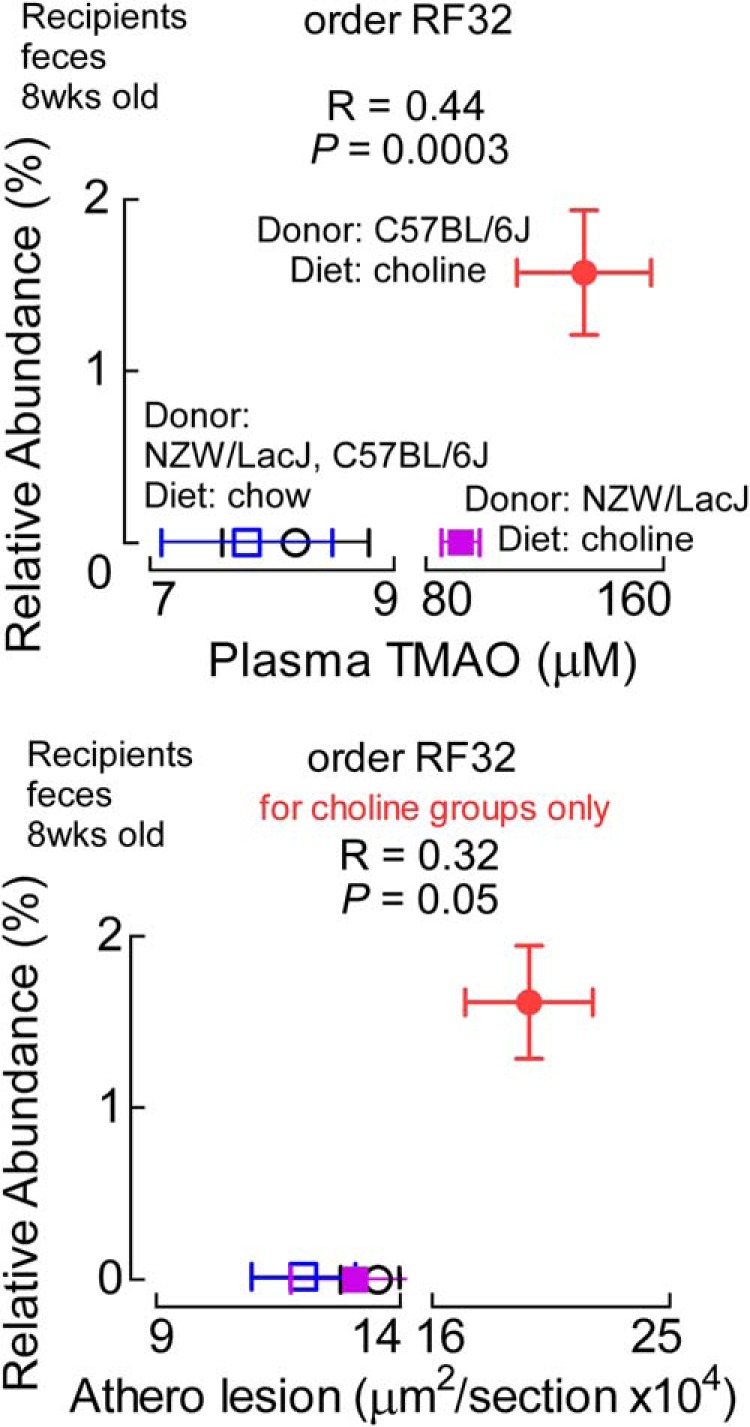
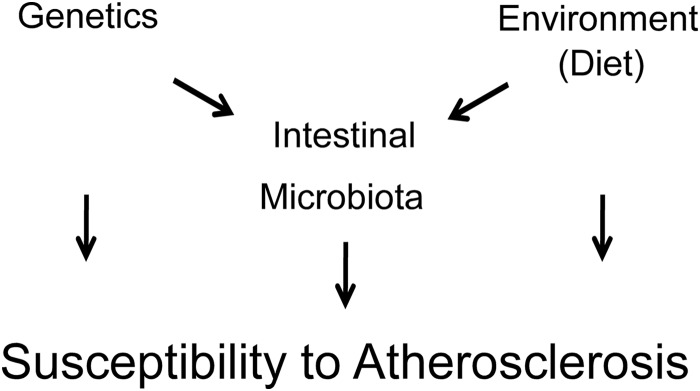
Recent studies indicate both clinical and mechanistic links between atherosclerotic heart disease and intestinal microbial metabolism of certain dietary nutrients producing trimethylamine N-oxide (TMAO). Here we test the hypothesis that gut microbial transplantation can transmit choline diet-induced TMAO production and atherosclerosis susceptibility. First, a strong association was noted between atherosclerotic plaque and plasma TMAO levels in a mouse diversity panel (n = 22 strains, r = 0.38; p = 0.0001). An atherosclerosis-prone and high TMAO-producing strain, C57BL/6J, and an atherosclerosis-resistant and low TMAO-producing strain, NZW/LacJ, were selected as donors for cecal microbial transplantation into apolipoprotein e null mice in which resident intestinal microbes were first suppressed with antibiotics. Trimethylamine (TMA) and TMAO levels were initially higher in recipients on choline diet that received cecal microbes from C57BL/6J inbred mice; however, durability of choline diet-dependent differences in TMA/TMAO levels was not maintained to the end of the study. Mice receiving C57BL/6J cecal microbes demonstrated choline diet-dependent enhancement in atherosclerotic plaque burden as compared with recipients of NZW/LacJ microbes. Microbial DNA analyses in feces and cecum revealed transplantation of donor microbial community features into recipients with differences in taxa proportions between donor strains that were transmissible to recipients and that tended to show coincident proportions with TMAO levels. Proportions of specific taxa were also identified that correlated with plasma TMAO levels in donors and recipients and with atherosclerotic lesion area in recipients. Atherosclerosis susceptibility may be transmitted via transplantation of gut microbiota. Gut microbes may thus represent a novel therapeutic target for modulating atherosclerosis susceptibility.

Keywords: Atherosclerosis; Choline; Dyslipidemia; Gut Microbiota; Koch's Postulate; Lipid; Nutrition; Phospholipid; Trimethylamine N-Oxide (TMAO).


Figures

FIGURE 1.
FIGURE 1.
Aortic lesion area and plasma TMAO levels are positively associated across multiple inbred strains of mice. A, atherosclerotic plaque and plasma TMAO levels were determined in female F1 progeny from the cross between C57BL/6 mice homozygous for the human Apob transgene and 22 distinct inbred strains of mice (Table 1) as described under “Experimental Procedures.” Each data point represents the mean ± S.E. of lesion area and terminal plasma TMAO level within each strain, with Spearman correlation across all strains shown. Inbred strains with markedly divergent atherosclerosis susceptibility and TMAO levels selected to serve as cecal microbe donors included the atherosclerosis-prone (large lesion and high plasma TMAO) C57BL/6J (red) and atherosclerosis-resistant (small lesion and low plasma TMAO) NZW/LacJ (blue) strains. The key for symbols, along with mean ± S.E. values for atherosclerosis area and TMAO levels in each strain, are found in Table 1. B, confirmation that selected donor strains, C57BL/6J and NZW/LacJ, demonstrate markedly different TMAO plasma levels on a choline-supplemented diet. Selected donor strains were placed on the choline-supplemented (1.06%, w/w) diet, and plasma TMAO levels were quantified at the indicated times (n = 4/group at each time point). *, p < 0.05 and **, p < 0.01 for comparison with baseline (prior to choline diet) plasma TMAO level in each inbred strain.
FIGURE 2.
FIGURE 2.
Cecal transplant experiment design, and plasma TMA and TMAO levels following transplantation of donor cecal microbiota. Top, cecal microbial transplantation study design. The timeline shows that recipient mice upon weaning were administered a mixture of broad spectrum antibiotics for 3 weeks. At 7 weeks of age, administration of antibiotics was terminated, and cecal microbial transplantation began with a gavage of cecal slurry freshly harvested from euthanized donor mice daily the first week, every other day the second week, and then weekly until the 20 weeks of age study end point. Vertical arrows indicate where timing of cecal microbial gavages changed. Middle and bottom, plasma TMAO (middle) and TMA (bottom) levels in the four recipient groups were monitored to track transmissibility of choline diet-dependent donor TMA/TMAO levels. Open symbols at 4 weeks of age represent plasma TMA and TMAO levels in recipients at time of weaning, prior to antibiotic administration. The dotted line at 7 weeks of age represents the end of administration of antibiotics and the beginning of both serial cecal microbial gavages, as well as the indicated diets. *, p < 0.05, **, p < 0.01 for comparison between similar time point recipients on the high choline diet of cecal microbe suspensions from C57BL/6J versus NZW/LacJ donors. Data points represent mean ± S.E.
FIGURE 3.
FIGURE 3.
Demonstration of choline diet-dependent transmissibility of atherosclerosis. At 20 weeks of age, the indicated numbers of recipient groups of Apoe−/− female mice were sacrificed, and aortic atherosclerotic plaque was quantified. Groups are defined by the indicated diet arm (chow versus choline) and donor source for cecal microbial suspensions given by gastric gavage (atherosclerosis-prone C57BL/6J versus atherosclerosis-resistant NZW/LacJ). A, representative Oil-Red-O staining images from each group. B, representative images following immunohistochemical staining with antibodies to the macrophage marker Iba1 from each group. C, aortic root lesion area quantified using Oil-Red-O staining, as described under “Experimental Procedures,” from the indicated numbers of mice. ANOVA, analysis of variance. D, relationship between aortic root lesion area (on y axis, in units of μm2 × 100,000) and plasma TMAO levels among recipients of cecal microbes from atherosclerosis-prone C57BL/6J donors, and Spearman rank correlation (r = 0.51, p = 0.006). E, aortic root lesion area quantified using Iba1 staining, as described under “Experimental Procedures,” from the indicated numbers of mice. Data points represent mean ± S.E.
FIGURE 4.
FIGURE 4.
Hepatic flavin monooxygenase activity among recipient mice. Total FMO activity in liver homogenates was determined as described under “Experimental Procedures” using liver recovered from the indicated recipient Apoe−/− mice included in the aortic atherosclerotic plaque study. As in Fig. 3, groups are defined by the indicated diet arm (chow versus choline) and donor source for cecal microbial suspensions given by gastric gavage (atherosclerosis-prone C57BL/6J versus atherosclerosis-resistant NZW/LacJ).
FIGURE 5.
FIGURE 5.
Demonstration of distinct cecal microbial compositions between donor strains and relatedness between donors and their respective recipient groups regardless of dietary arm. A, unweighted UniFrac distances plotted in principal coordinates analysis space comparing cecum microbial communities between two donor strains. Each data point represents a sample from a distinct mouse projected onto the first two principal coordinates (percentage of variation explained by each principal coordinates (PCo) is shown in parentheses). Circles represent C57BL/6J, and squares represent NZW/LacJ. B, unweighted pair group method with arithmetic mean clustering on the cecal samples from the two donor groups and all four recipient groups collected at 20 weeks of age. Beta diversity distance matrix distances are displayed into a hierarchical tree in which branches, and lengths illustrate how closely the groups are related to one another. Recipients of cecal microbes from C57BL/6J donors, regardless of diet, are more closely related to C57BL/6J donors, and conversely, recipients of cecal microbes from NZW/LacJ donors, regardless of diet, are more closely related to NZW/LacJ donors.
FIGURE 6.
FIGURE 6.
Fecal microbial compositions of donor strains. Percent abundances of genus level taxa displayed in a stacked bar graph show differences between inbred donor strains (data for chow diet shown). Taxa in higher abundance in C57BL/6J donors are colored in reds, and those higher in NZW/LacJ donors are displayed in blues. Results shown represent averages among C57BL/6J (n = 15) and NZW/LacJ (n = 16) donors.
FIGURE 7.
FIGURE 7.
Defining donor characteristic taxa in cecal and fecal microbiota. A and B, microbial DNA encoding 16 S rRNA was analyzed from C57BL/6J and NZW/LacJ cecum (A) and feces (B) (n = 15 for both donor groups). Shown is a histogram displaying LDA scores calculated with the LEfSe algorithm identifying taxa most characteristic (increased abundance) of donor strain type, as described under “Experimental Procedures.” Taxa enriched in C57BL/6J are indicated with a positive LDA score (red), and taxa enriched in NZW/LacJ donors have a negative LDA score (blue). Only taxa meeting an LDA significance threshold >2 are shown. Donor characteristic taxa common to both cecal and fecal microbiota (10 overlapping taxa were identified) are indicated with color label: red for C57BL/6J characteristic donor; blue for NZW/LacJ characteristic donor.
FIGURE 8.
FIGURE 8.
Donor microbial community features transfer to recipients. The 10 overlapping donor characteristic taxa from LEfSe analysis of donor cecal and fecal samples (Fig. 7) were selected for further investigation in recipient mice. A, stacked bar graphs showing the percent abundance accounted for by the 10 selected taxa within DNA encoding the 16 S rRNA recovered from feces from the indicated donors and recipients. The key at the right lists the taxa with assigned color. Red, orange, and yellow colors indicate taxa higher in abundance in C57BL/6J donors, and blue, purple, and green colors indicate taxa higher in abundance in NZW/LacJ donors. B, pie charts of average abundance of these 10 taxa for the two donor groups (top) and the four recipient groups in feces recovered at 8 weeks of age.
FIGURE 9.
FIGURE 9.
Distribution of 10 identified donor characteristic taxa in cecum of recipients at 20 weeks. A, 10 donor characteristic taxa (Fig. 7) were identified whose proportions in either cecum or feces remained indicative of the donor, as described under “Results.” Shown here are the proportions of these 10 characteristic taxa observed at 20 weeks of age in cecal samples recovered from the indicated recipient groups. B, left, bar graph illustrating the proportions of the 10 donor characteristic taxa, which make up 6.8% of the composition of the fecal microbes within C57BL/6J Apoe−/− recipient female mice before antibiotic treatment. Right, the pie chart shows the proportions among the 10 donor characteristic taxa in the C57BL/6J apoE−/− recipient female mice before antibiotic treatment.
FIGURE 10.
FIGURE 10.
Proportions of the genus Prevotella in feces are associated with plasma TMAO plasma levels and aortic root atherosclerosis extent. A and C, the proportion of Prevotella in fecal samples recovered from the indicated 8-week-old recipient groups is plotted (y axis) versus plasma TMAO levels (A) or aortic root atherosclerotic plaque level (C) (x axis), with each data point representing mean ± S.E. from n > 12 mice. A positive correlation (Spearman) is observed (r = 0.44, p = 0.0003) between Prevotella proportions and TMAO levels across all four recipient groups, and between the proportion of Prevotella and atherosclerosis extent among recipients provided the high choline-supplemented diet (r = 0.37, p = 0.02). B, relative abundances of Prevotella throughout the course of the study followed the same trend as the TMAO levels in that the values started to converge by 16 weeks and at the end point.
FIGURE 11.
FIGURE 11.
Examples of donor characteristic taxa that associate with plasma TMAO levels and atherosclerosis in recipients. The graphs in the left column plot plasma TMAO concentrations on the x-axes, whereas graphs in the right column plot aortic atherosclerotic lesion extent on the x-axes of the indicated recipient groups. All y-axes contain the relative abundance of the indicated donor characteristic taxa as identified from the LEfSe analysis (Fig. 7). Spearman correlation coefficients and false discovery rate adjusted p values are shown. A, taxa Erysipelotrichaceae, characteristic (more abundant) of C57BL/6J donor mice, is positively correlated with TMAO across all four recipient groups and with atherosclerosis extent for recipients of atherosclerosis-prone C57BL/6J cecal microbes. B, taxa RF39, also characteristic of C57BL/6J donors, is positively correlated with both atherosclerosis extent (all recipients) and TMAO levels among C57BL/6J recipient groups. C, proportions of the taxa Dorea, characteristic of NZW/LacJ donors, demonstrates negative associations with both plasma TMAO levels and atherosclerosis extent across all recipient groups. Data points represent mean ± S.E.
FIGURE 12.
FIGURE 12.
Example of donor characteristic taxa whose proportions are associated with plasma TMAO levels and atherosclerosis extent in recipients. Proportions of order RF32 (Alphaproteobacteria class), noted as a characteristic taxa of C57BL/6J donors from cecal samples, are associated positively with TMAO across all four recipient groups (top) and with atherosclerosis among the two recipient groups on the choline diet (bottom). Data points represent mean ± S.E.
FIGURE 13.
FIGURE 13.
Summary schematic illustrating reciprocal interactions between genetics, environment, and intestinal microbiota, all of which impact on atherosclerosis susceptibility.

Similar articles

Cited by

References

    1. Brown J. M., Hazen S. L. (2014) Metaorganismal nutrient metabolism as a basis of cardiovascular disease. Curr. Opin. Lipidol. 25, 48–53 - PMC - PubMed
    1. Bäckhed F., Ley R. E., Sonnenburg J. L., Peterson D. A., Gordon J. I. (2005) Host-bacterial mutualism in the human intestine. Science 307, 1915–1920 - PubMed
    1. Cho I., Blaser M. J. (2012) The human microbiome: at the interface of health and disease. Nat. Rev. Genet. 13, 260–270 - PMC - PubMed
    1. Kau A. L., Ahern P. P., Griffin N. W., Goodman A. L., Gordon J. I. (2011) Human nutrition, the gut microbiome and the immune system. Nature 474, 327–336 - PMC - PubMed
    1. Wang Z., Klipfell E., Bennett B. J., Koeth R., Levison B. S., Dugar B., Feldstein A. E., Britt E. B., Fu X., Chung Y. M., Wu Y., Schauer P., Smith J. D., Allayee H., Tang W. H., DiDonato J. A., Lusis A. J., Hazen S. L. (2011) Gut flora metabolism of phosphatidylcholine promotes cardiovascular disease. Nature 472, 57–63 - PMC - PubMed

Publication types

MeSH terms