Cholera-toxin suppresses carcinogenesis in a mouse model of inflammation-driven sporadic colon cancer
- PMID: 25550315
- PMCID: PMC4402334
- DOI: 10.1093/carcin/bgu325
Cholera-toxin suppresses carcinogenesis in a mouse model of inflammation-driven sporadic colon cancer
Abstract
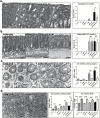
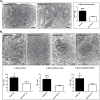
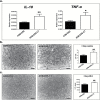
Human studies and clues from animal models have provided important links between gastrointestinal (GI) tract bacteria and colon cancer. Gut microbiota antigenic stimuli play an important role in shaping the intestinal immune responses. Therefore, especially in the case of inflammation-associated colon cancer, gut bacteria antigens may affect tumorigenesis. The present study aimed to investigate the effects of the oral administration of a bacterial product with known immunomodulatory properties on inflammation-driven colorectal neoplasmatogenesis. For that, we used cholera-toxin and a well-established mouse model of colon cancer in which neoplasia is initiated by a single dose of the genotoxic agent azoxymethane (AOM) and subsequently promoted by inflammation caused by the colitogenic substance dextran sodium sulfate (DSS). We found that a single, low, non-pathogenic dose of CT, given orally at the beginning of each DSS treatment cycle downregulated neutrophils and upregulated regulatory T-cells and IL-10 in the colonic mucosa. The CT-induced disruption of the tumor-promoting character of DSS-induced inflammation led to the reduction of the AOM-initiated colonic polypoidogenesis. This result adds value to the emerging notion that certain GI tract bacteria or their products affect the immune system and render the microenvironment of preneoplastic lesions less favorable for promoting their evolution to cancer.
© The Author 2014. Published by Oxford University Press. All rights reserved. For Permissions, please email: journals.permissions@oup.com.
Figures


Similar articles
-
Nicotine suppresses acute colitis and colonic tumorigenesis associated with chronic colitis in mice.Am J Physiol Gastrointest Liver Physiol. 2014 Nov 15;307(10):G968-78. doi: 10.1152/ajpgi.00346.2013. Epub 2014 Sep 25. Am J Physiol Gastrointest Liver Physiol. 2014. PMID: 25258409
-
Dose-dependent promoting effect of dextran sodium sulfate on mouse colon carcinogenesis initiated with azoxymethane.Histol Histopathol. 2005 Apr;20(2):483-92. doi: 10.14670/HH-20.483. Histol Histopathol. 2005. PMID: 15736053
-
Gamma-tocopherol attenuates moderate but not severe colitis and suppresses moderate colitis-promoted colon tumorigenesis in mice.Free Radic Biol Med. 2013 Dec;65:1069-1077. doi: 10.1016/j.freeradbiomed.2013.08.187. Epub 2013 Sep 4. Free Radic Biol Med. 2013. PMID: 24013093 Free PMC article.
-
Dextran sulfate sodium-induced colitis-associated neoplasia: a promising model for the development of chemopreventive interventions.Acta Pharmacol Sin. 2007 Sep;28(9):1450-9. doi: 10.1111/j.1745-7254.2007.00695.x. Acta Pharmacol Sin. 2007. PMID: 17723178 Review.
-
The interrelationships of the gut microbiome and inflammation in colorectal carcinogenesis.Clin Lab Med. 2014 Dec;34(4):699-710. doi: 10.1016/j.cll.2014.08.002. Epub 2014 Sep 15. Clin Lab Med. 2014. PMID: 25439270 Free PMC article. Review.
Cited by
-
Association between post-diagnostic use of cholera vaccine and risk of death in prostate cancer patients.Nat Commun. 2018 Jun 18;9(1):2367. doi: 10.1038/s41467-018-04814-4. Nat Commun. 2018. PMID: 29915319 Free PMC article.
-
Oral Administration of Microencapsulated B. Longum BAA-999 and Lycopene Modulates IGF-1/IGF-1R/IGFBP3 Protein Expressions in a Colorectal Murine Model.Int J Mol Sci. 2019 Aug 31;20(17):4275. doi: 10.3390/ijms20174275. Int J Mol Sci. 2019. PMID: 31480481 Free PMC article.
-
Old enemies meet new friends for colon cancer prevention.Oncoimmunology. 2015 Jun 1;4(10):e1027474. doi: 10.1080/2162402X.2015.1027474. eCollection 2015 Oct. Oncoimmunology. 2015. PMID: 26451294 Free PMC article.
-
Repurposing Infectious Diseases Vaccines Against Cancer.Front Oncol. 2021 May 13;11:688755. doi: 10.3389/fonc.2021.688755. eCollection 2021. Front Oncol. 2021. PMID: 34055652 Free PMC article. Review.
-
Suppression of colorectal tumorigenesis by recombinant Bacteroides fragilis enterotoxin-2 in vivo.World J Gastroenterol. 2017 Jan 28;23(4):603-613. doi: 10.3748/wjg.v23.i4.603. World J Gastroenterol. 2017. PMID: 28216966 Free PMC article.
References
-
- Boyle P., et al. (2008). World Cancer Report 2008. International Agency for Research on Cancer; Distributed by WHO Press, Lyon.
-
- Rook G.A., et al. (2011). Infection, immunoregulation, and cancer. Immunol. Rev., 240, 141–159. - PubMed
Publication types
MeSH terms
Substances
Grants and funding
LinkOut - more resources
Full Text Sources
Other Literature Sources
Molecular Biology Databases

