. 2015 Jan 13;112(2):E194-203.
doi: 10.1073/pnas.1420406112. Epub 2014 Dec 30.

Tracking heavy water (D2O) incorporation for identifying and sorting active microbial cells

Affiliations

Tracking heavy water (D2O) incorporation for identifying and sorting active microbial cells

David Berry et al. Proc Natl Acad Sci U S A. .

Abstract

Microbial communities are essential to the function of virtually all ecosystems and eukaryotes, including humans. However, it is still a major challenge to identify microbial cells active under natural conditions in complex systems. In this study, we developed a new method to identify and sort active microbes on the single-cell level in complex samples using stable isotope probing with heavy water (D2O) combined with Raman microspectroscopy. Incorporation of D2O-derived D into the biomass of autotrophic and heterotrophic bacteria and archaea could be unambiguously detected via C-D signature peaks in single-cell Raman spectra, and the obtained labeling pattern was confirmed by nanoscale-resolution secondary ion MS. In fast-growing Escherichia coli cells, label detection was already possible after 20 min. For functional analyses of microbial communities, the detection of D incorporation from D2O in individual microbial cells via Raman microspectroscopy can be directly combined with FISH for the identification of active microbes. Applying this approach to mouse cecal microbiota revealed that the host-compound foragers Akkermansia muciniphila and Bacteroides acidifaciens exhibited distinctive response patterns to amendments of mucin and sugars. By Raman-based cell sorting of active (deuterated) cells with optical tweezers and subsequent multiple displacement amplification and DNA sequencing, novel cecal microbes stimulated by mucin and/or glucosamine were identified, demonstrating the potential of the nondestructive D2O-Raman approach for targeted sorting of microbial cells with defined functional properties for single-cell genomics.

Keywords: Raman microspectroscopy; carbohydrate utilization; ecophysiology; nitrifier; single-cell microbiology.


Conflict of interest statement

The authors declare no conflict of interest.

Figures

Fig. 1.
Fig. 1.
E. coli incorporation of D from heavy water during growth as detected by Raman microspectroscopy and NanoSIMS. (A) Raman spectra of single E. coli cells grown to stationary phase in media with heavy water (0%, 2.5%, 5%, 10%, 15%, 20%, 30%, 50%, and 100% D2O of growth water). Ten to 21 single-cell spectra were used to produce mean spectra. It should be noted that identical peak shifts were observed in E. coli cells that were grown in the presence of deuterated glucose instead of heavy water (SI Appendix, Fig. S11). AU, arbitrary unit. (B) Difference between mean spectra of E. coli cells from D2O-containing media and cells grown without D2O. Colors are the same as in A. (C) Quantification of D incorporation in individual E. coli cells from the same experiment as detected by NanoSIMS and shown as the isotope fraction D/(H + D) given as at%. All isotope fraction images are on the same scale (0–100 at%). 31P signal intensity distribution is displayed to indicate the location of cellular biomass. (D) Comparison of D content in single cells measured by NanoSIMS with respect to the D2O percentage of growth water. Box plots show the quartiles for each population of cells. The detection limit, defined as the mean + 3 SD of unlabeled cells, is shown in gray (0.17 at%). A linear regression between D2O concentration and cellular D is shown in red (R2 = 0.84).
Fig. 2.
Fig. 2.
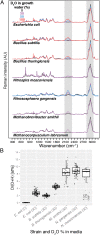
C-D signature region of Raman spectra is conserved in diverse microorganisms. (A) Representative Raman spectra of microorganisms cultivated in media amended with various percentages of heavy water. Characteristic C-D and C-H regions are shaded in gray. N. moscoviensis and N. gargensis did not grow with 100% D2O. Both methanogens were only grown at 30% D2O and not tested at other levels. (B) NanoSIMS quantification of cellular D incorporation (at%) of different strains when grown in 30% D2O (and E. coli with 0% D2O). Each point is a measurement of a single cell, and box plots indicate quartiles. Note that only a few cells of N. moscoviensis became active after incubation (low-active/nonactive cells are shown in gray), a feature we have also observed by other techniques in medium without heavy water. M. smithii cultures produced extracellular substances enriched in D that were excluded from the analysis. Autotrophic organisms (M. smithii, N. gargensis, and N. moscoviensis) were significantly more enriched in D than heterotrophic organisms (E. coli, B. subtilis, and B. thuringiensis) when cultivated in the presence of the same D2O concentration (30% D2O; ANOVA, P < 0.001).
Fig. 3.
Fig. 3.
Application of D2O to monitor the activity of mouse cecum microbiota on a single-cell level after in vitro incubation with various unlabeled substrates. Experiments were performed on cecal biomass amended with glucose, glucosamine, mannose, mucin, or nothing and were incubated overnight. (A) Representative FISH images of all Bacteria (blue), B. acidifaciens (red), A. muciniphila (green), and composite. (Scale bar: 5 μm.) (B) Percentage of cells from the respective target population for which a C-D peak could be detected by Raman microspectroscopy under each incubation condition. For each target and incubation condition, 68–92 cells were measured. (C) Contributions of B. acidifaciens and A. muciniphila to all labeled (Left) and highly labeled (Right, >10%CD) cells in the gut community in the different experiments are displayed. These contributions were calculated as follows: [Relative abundance of target population as measured by quantitative FISH using a specific probe] * [Proportion of target population labeled]/[Relative abundance of all labeled cells]. (D) Intensity of deuterium incorporation in single cells of randomly selected (DAPI-positive) and specific FISH probe-defined populations, measured by %CD. Single-cell spectra are denoted by black points, and population quartiles are shown as box plots. The red horizontal line at 2.78%CD indicates the threshold for considering a cell labeled. It was determined by calculating the mean + 3 SD of %CD in randomly selected cells from the cecum sample that were incubated without addition of heavy water. All comparisons are statistically significantly (P < 0.05), except for those comparisons denoted by a black bar connecting them and labeled by N.S. (not significant).
Fig. 4.
Fig. 4.
Targeted sorting and phylogenetic analysis of deuterium-labeled cells from two gut microbiota incubations. (A) Raman spectra of 40 highly labeled cells from the glucosamine and mucin incubations, respectively, that were sorted using optical tweezers. Arrows indicate the strong C-D peaks in the spectra of the sorted cells. A few representative spectra from cells that were not sorted from the mucin incubation are also shown in gray to allow for comparison. (B) Phylogenetic analysis of partial 16S rRNA gene sequences recovered from sorted cells [the number of sequences is indicated and colored blue for mucin (Muc) incubation and red for glucosamine (GlcN) incubation]. The tree was produced using near-full-length sequences from organisms closely related to clone sequences (indicated in black) using RAxML with 500 bootstrap resamplings (black circles indicate >90% support, white circles indicate >75% support). Clone sequences were then added to the tree using the quick-add parsimony method in ARB. The taxonomic classification of sequences is indicated. Coverage of A. muciniphila and B. acidifaciens FISH probes (estimated from full-length sequences) is indicated. The scale bar indicates the number of substitutions per site. A fully expanded tree is presented in SI Appendix, Fig. S10.

References

    1. Frias-Lopez J, et al. Microbial community gene expression in ocean surface waters. Proc Natl Acad Sci USA. 2008;105(10):3805–3810. - PMC - PubMed
    1. Urich T, et al. Simultaneous assessment of soil microbial community structure and function through analysis of the meta-transcriptome. PLoS ONE. 2008;3(6):e2527. - PMC - PubMed
    1. VerBerkmoes NC, Denef VJ, Hettich RL, Banfield JF. Systems biology: Functional analysis of natural microbial consortia using community proteomics. Nat Rev Microbiol. 2009;7(3):196–205. - PubMed
    1. Adamczyk J, et al. The isotope array, a new tool that employs substrate-mediated labeling of rRNA for determination of microbial community structure and function. Appl Environ Microbiol. 2003;69(11):6875–6887. - PMC - PubMed
    1. Mayali X, et al. High-throughput isotopic analysis of RNA microarrays to quantify microbial resource use. ISME J. 2012;6(6):1210–1221. - PMC - PubMed

Publication types

MeSH terms

Associated data

LinkOut - more resources