Sodium, saturated fat, and trans fat content per 1,000 kilocalories: temporal trends in fast-food restaurants, United States, 2000-2013
- PMID: 25551183
- PMCID: PMC4283357
- DOI: 10.5888/pcd11.140335
Sodium, saturated fat, and trans fat content per 1,000 kilocalories: temporal trends in fast-food restaurants, United States, 2000-2013
Abstract
Introduction: Intakes of sodium, saturated fat, and trans fat remain high despite recommendations to limit these nutrients for cardiometabolic risk reduction. A major contributor to intake of these nutrients is foods prepared outside the home, particularly from fast-food restaurants.
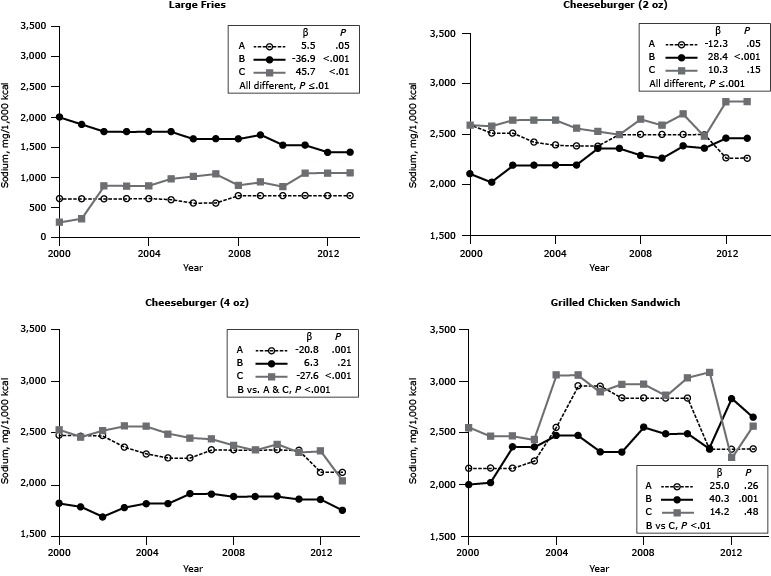
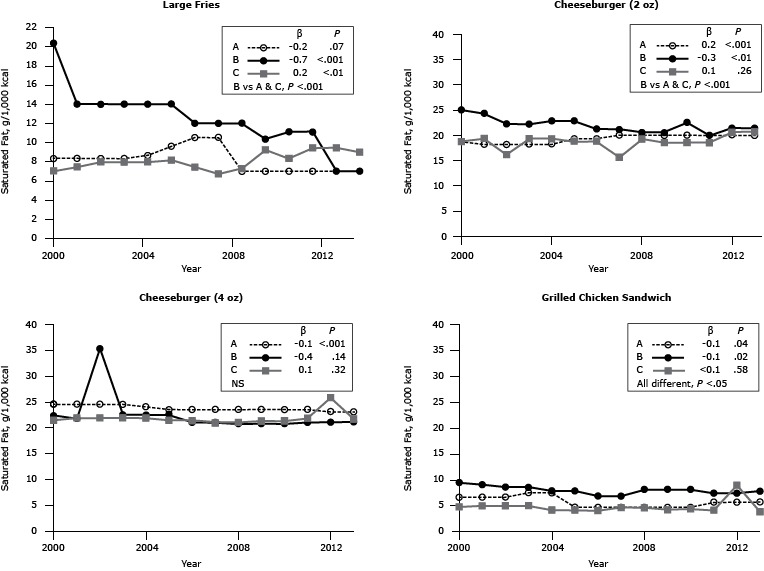
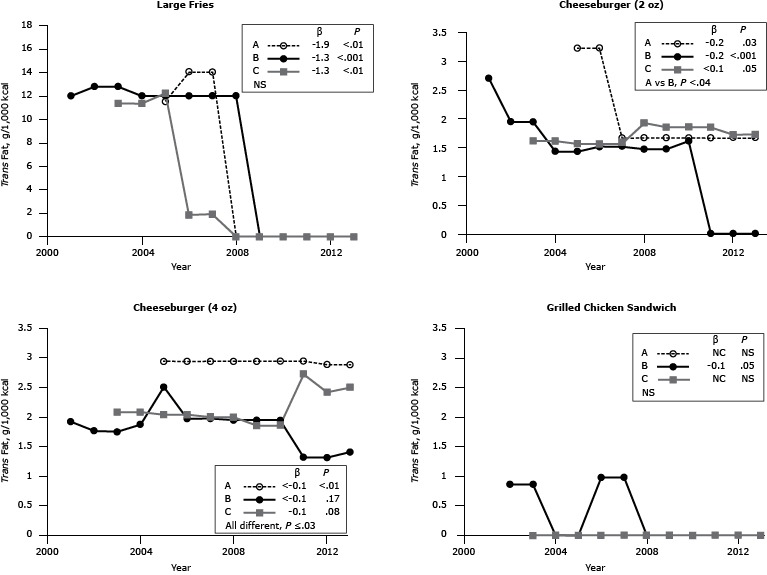
Methods: We analyzed the nutrient content of frequently ordered items from 3 US national fast-food chains: fried potatoes (large French fries), cheeseburgers (2-oz and 4-oz), and a grilled chicken sandwich. We used an archival website to obtain data on sodium, saturated fat, and trans fat content for these items from 2000 through 2013. The amount of each nutrient per 1,000 kcal was calculated to determine whether there were trends in product reformulation.
Results: Sodium content per 1,000 kcal differed widely among the 3 chains by food item, precluding generalizations across chains. During the 14-year period, sodium content per 1,000 kcal for large French fries remained high for all 3 chains, although the range narrowed from 316-2,000 mg per 1,000 kcal in 2000 to 700-1,420 mg per 1,000 kcal in 2013. Among the items assessed, cheeseburgers were the main contributor of saturated fat, and there was little change in content per 1,000 kcal for this item during the 14-year period. In contrast, there was a sharp decline in saturated and trans fat content of large French fries per 1,000 kcal. Post-2009, the major contributor of trans fat per 1,000 kcal was cheeseburgers; trans fat content of this item remained stable during the 14-year period.
Conclusion: With the exception of French fries, little evidence was found during the 14-year period of product reformulation by restaurants to become more consistent with dietary guidance to reduce intakes of sodium and saturated fat.
Figures
Comment in
-
Considering trends in sodium, trans fat, and saturated fat as key metrics of cardiometobolic risk reduction.Prev Chronic Dis. 2014 Dec 31;11:E230. doi: 10.5888/pcd11.140561. Prev Chronic Dis. 2014. PMID: 25551185 Free PMC article. No abstract available.
References
-
- US Department of Agriculture. Dietary guidelines for Americans, 2010, 7th edition. Washington (DC): US Department of Health and Human Services; 2010. - PubMed
Publication types
MeSH terms
Substances
LinkOut - more resources
Full Text Sources
Other Literature Sources
Medical