. 2014 Dec 31:12:771.
doi: 10.1186/s12915-014-0099-8.

Antagonistic roles in fetal development and adult physiology for the oppositely imprinted Grb10 and Dlk1 genes

Affiliations

Antagonistic roles in fetal development and adult physiology for the oppositely imprinted Grb10 and Dlk1 genes

Marta Madon-Simon et al. BMC Biol. .

Abstract

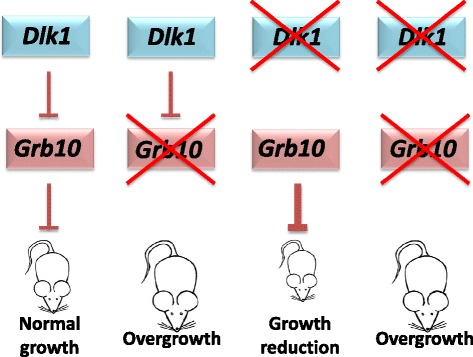
Background: Despite being a fundamental biological problem the control of body size and proportions during development remains poorly understood, although it is accepted that the insulin-like growth factor (IGF) pathway has a central role in growth regulation, probably in all animals. The involvement of imprinted genes has also attracted much attention, not least because two of the earliest discovered were shown to be oppositely imprinted and antagonistic in their regulation of growth. The Igf2 gene encodes a paternally expressed ligand that promotes growth, while maternally expressed Igf2r encodes a cell surface receptor that restricts growth by sequestering Igf2 and targeting it for lysosomal degradation. There are now over 150 imprinted genes known in mammals, but no other clear examples of antagonistic gene pairs have been identified. The delta-like 1 gene (Dlk1) encodes a putative ligand that promotes fetal growth and in adults restricts adipose deposition. Conversely, Grb10 encodes an intracellular signalling adaptor protein that, when expressed from the maternal allele, acts to restrict fetal growth and is permissive for adipose deposition in adulthood.

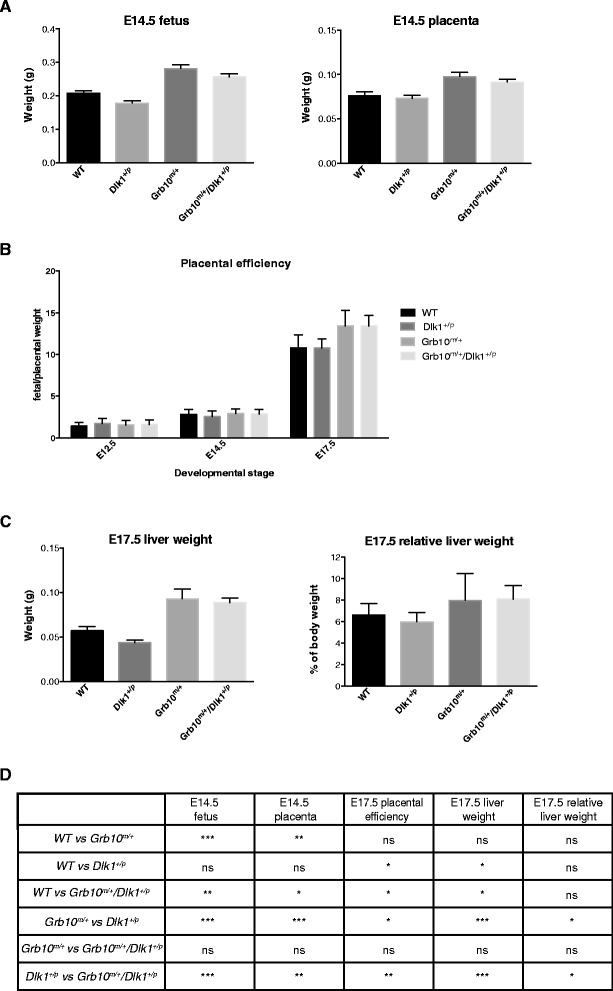
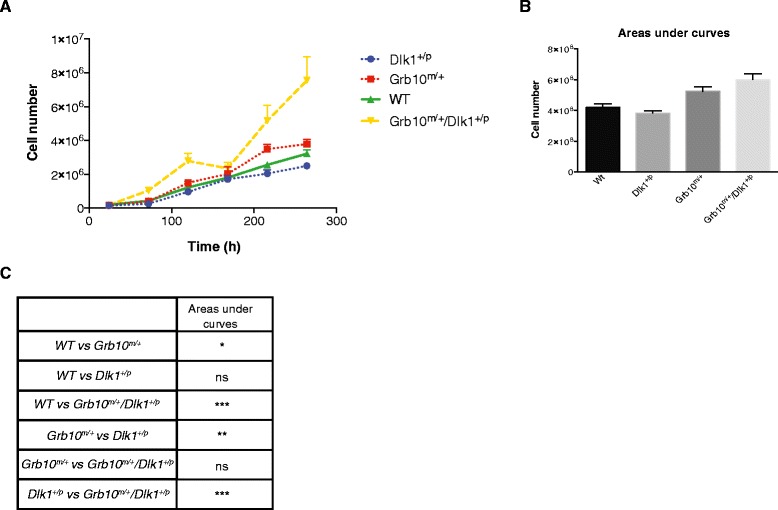
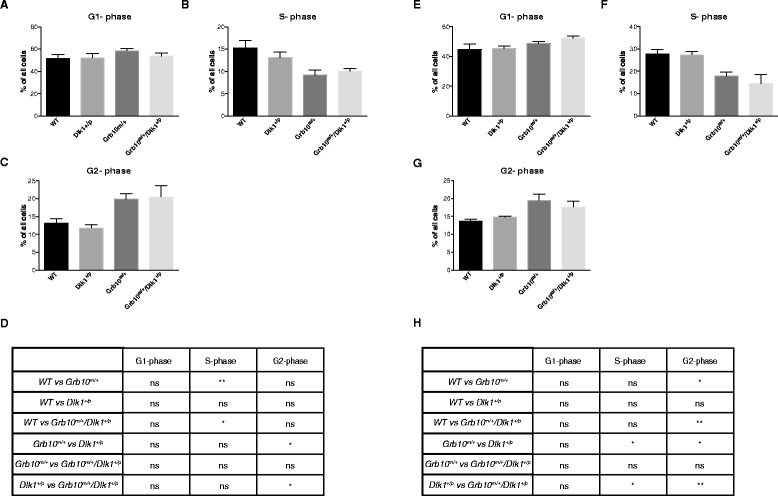
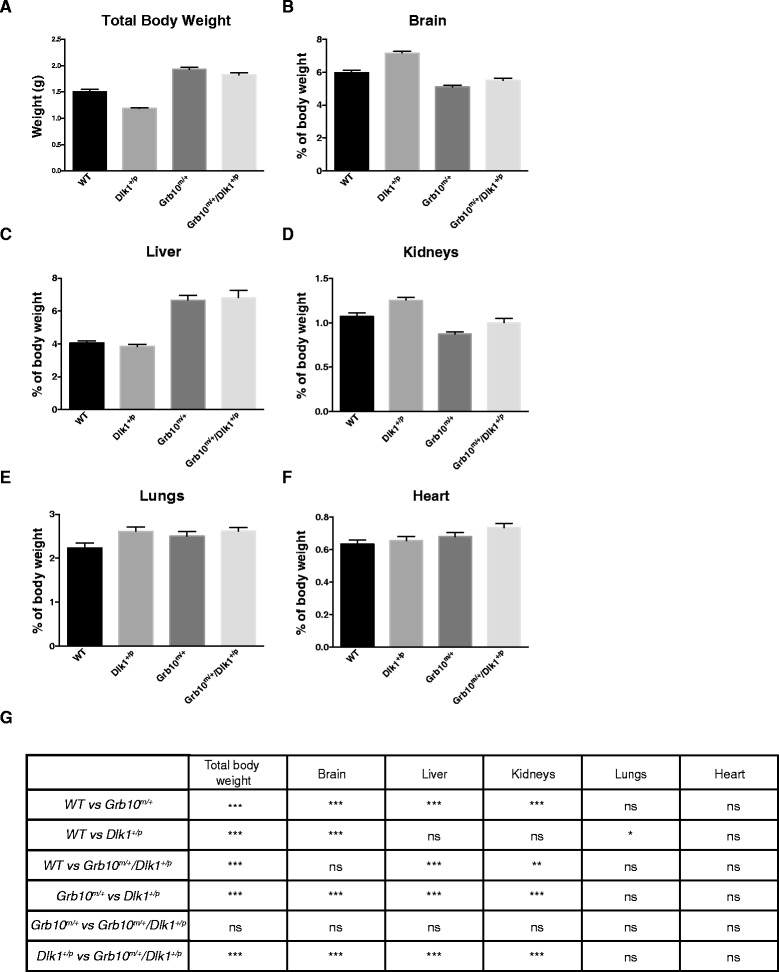
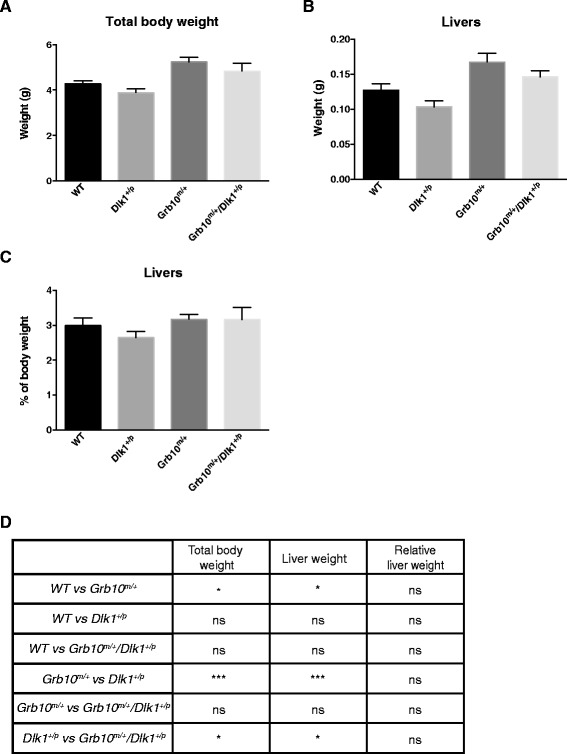
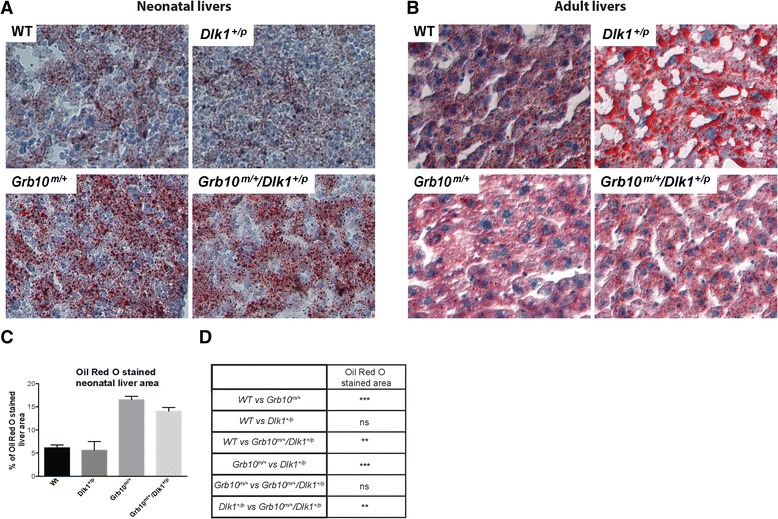
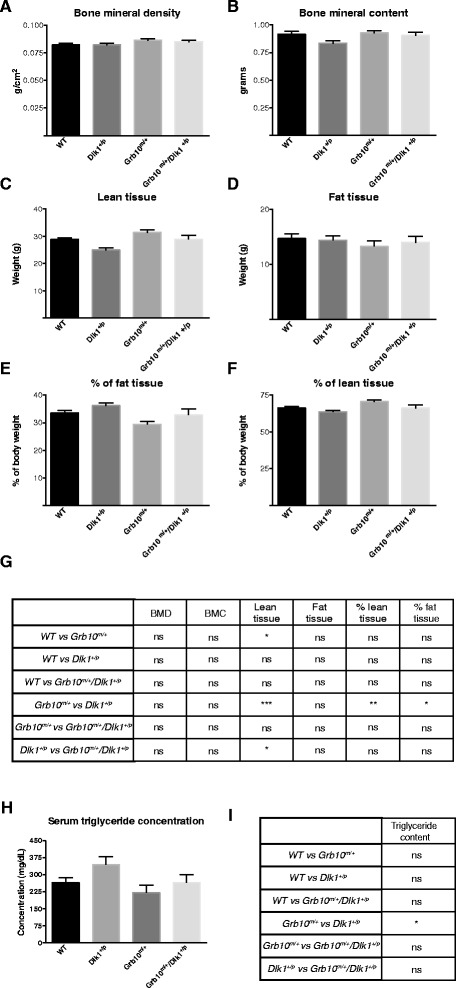
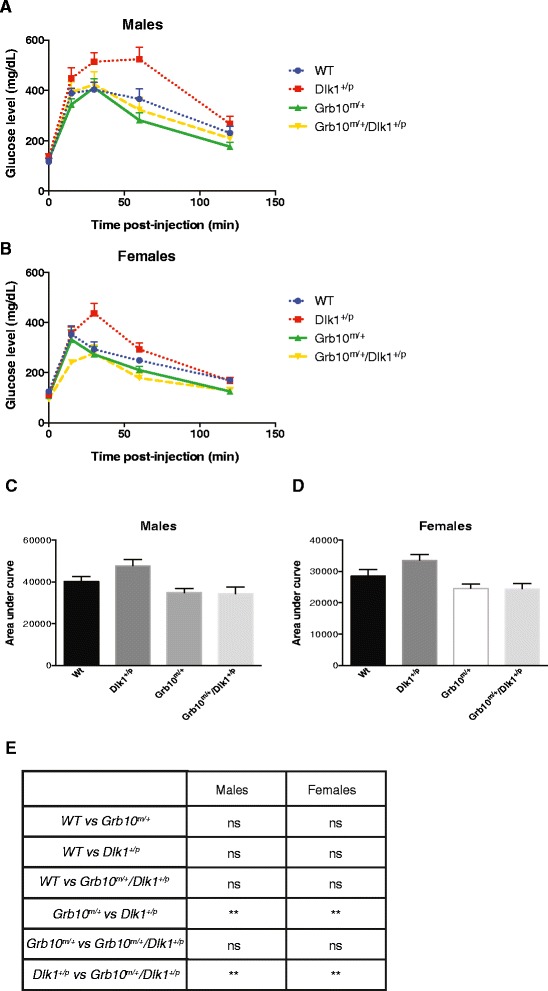
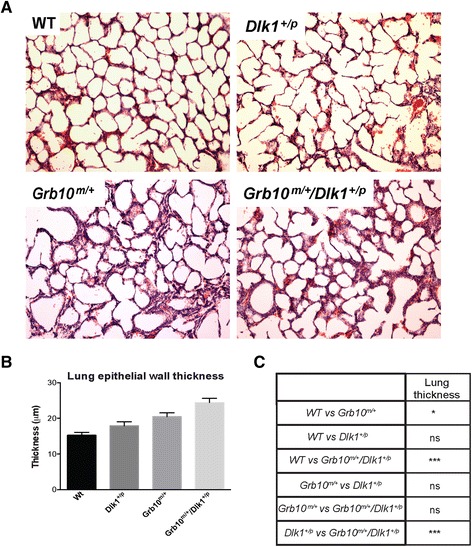
Results: Here, using knockout mice, we present genetic and physiological evidence that these two factors exert their opposite effects on growth and physiology through a common signalling pathway. The major effects are on body size (particularly growth during early life), lean:adipose proportions, glucose regulated metabolism and lipid storage in the liver. A biochemical pathway linking the two cell signalling factors remains to be defined.

Conclusions: We propose that Dlk1 and Grb10 define a mammalian growth axis that is separate from the IGF pathway, yet also features an antagonistic imprinted gene pair.


Figures

Figure 1
Figure 1
Analyses of fetal, placental and liver weights during mid- to late-gestation. A) At E14.5 Grb10 m/+ and Grb10 m/+ /Dlk1 +/p fetuses and placentae were significantly overgrown when compared to wild type and Dlk1 +/p fetuses. B) Placental efficiency, calculated as a ratio of fetal/placental mass, was significantly increased at E17.5, but not E12.5 or E14.5, for Grb10 m/+ and Grb10 m/+ /Dlk1 +/p conceptuses when compared to both wild type and Dlk1 +/p. C) At E17.5 Grb10 m/+ and Grb10 m/+ /Dlk1 +/p fetal livers were significantly heavier than both wild type and Dlk1 +/p livers. When expressed as a proportion of body weight (relative weights) Grb10 m/+ /Dlk1 +/p fetal livers were significantly enlarged compared to wild type and Dlk1 +/p livers. D) Table summarising results of statistical analyses in A-C. All values represent means ± SEM, one way ANOVA with Tukey’s post-hoc analysis. For E12.5 WT n = 23, Dlk1 +/p n = 13, Grb10 m/+ n = 13, Grb10 m/+ /Dlk1 +/p n = 16 ; for E14.5 WT n = 19, Dlk1 +/p n = 22, Grb10 m/+ n = 22, Grb10 m/+ /Dlk1 +/p n = 25; for E17.5 WT n = 4, Dlk1 +/p n = 8, Grb10 m/+ n = 6 Grb10 m/+ /Dlk1 +/p n = 8; * P <0.05; ** P <0.01; *** P <0.001. ANOVA, analysis of variance; E, embryonic day; SEM, standard error of the mean; vs, versus; WT, wild type.
Figure 2
Figure 2
Proliferation rates of E14.5 primary embryonic fibroblasts (PMEFs). A) Growth curves were plotted for E14.5 PMEFs seeded at equivalent densities and then cultured for 264 hours. Each data point represents the mean of three independent experiments (each comparing cells of all four genotypes), four replicates for each time point, counted twice. B) Areas under curves calculated using data from A. C) Statistical analysis of total areas under growth curves revealed that Grb10 m/+ and Grb10 m/+ /Dlk1 +/p PMEFs each proliferated significantly more than both wild type and Dlk1 +/p cells. All values represent means ± SEM, tested using one way ANOVA with Tukey’s post-hoc analysis; * P <0.05; ** P <0.01; *** P <0.001. For each genotype, n = 3. ANOVA, analysis of variance; E, embryonic day; SEM, standard error of the mean.
Figure 3
Figure 3
FACS analysis of cell cycle fractions in propidium iodide stained cultured E14.5 PMEFs and disaggregated E11.5 fetuses. A-C) Relative DNA content of passage 3 PMEFs, estimated for 100,000 cells per sample. Cells were allocated to bins representing the G1- (A), S- (B) and G2- (C) phases of the cell cycle. Cell populations that were <2n and >4n were excluded from the analysis. D) Table summarising results of statistical analysis of data in A-C. All values represent means ± SEM, one way ANOVA with Tukey’s post-hoc analysis. WT n = 6, Dlk1 +/p n = 5, Grb10 m/+ n = 7, Grb10 m/+ /Dlk1 +/p n = 6; E-G) Cells derived directly from wild type, Dlk1 +/p, Grb10 m/+ and Grb10 m/+ /Dlk1 +/p E11.5 fetuses were used to estimate relative DNA content for 100,000 cells per sample. Cells were allocated to bins representing the G1- (E), S- (F) and G2- (G) phases of the cell cycle. H) Table summarising results of statistical analysis of data in E-G. All values represent means ± SEM, one way ANOVA with Tukey’s post-hoc analysis. WT n = 7, Dlk1 +/p n = 8, Grb10 m/+ n = 6, Grb10 m/+ /Dlk1 +/p n = 5. For both PMEFs (A-D) and E11.5 fetal cells (E-H) significantly lower percentages of both Grb10 m/+ and Grb10 m/+ /Dlk1 +/p cells were found in S-phase of the cell cycle in comparison to either wild type (PMEFs) or Dlk1 +/p (E11.5 embryo) cells. Conversely, significantly higher percentages of both Grb10 m/+ and Grb10 m/+ /Dlk1 +/p cells were found in G2-phase of the cell cycle in comparison to wild type and Dlk1 +/p- E11.5 embryo cells. Similar trends were seen for PMEFs but only the comparisons of Grb10 m/+ and Grb10 m/+ /Dlk1 +/p with wild type reached significance. No significant differences were observed for numbers of cells in G1 for comparisons between any of the four genotypes; * P <0.05. ANOVA, analysis of variance; E, embryonic day; FACS, fluorescence activated cell sorting; PMEF, primary mouse embryonic fibroblasts; SEM, standard error of the mean; WT, wild type.
Figure 4
Figure 4
Whole body and relative organ weight analysis of neonates. A) Dlk1 +/p mice were significantly growth retarded whereas Grb10 m/+ and Grb10 m/+ /Dlk1 +/p animals demonstrated whole body overgrowth when compared to wild type and Dlk1 +/p mice. Note, this graph is the same as that shown in Additional file 3: Figure S3A, reproduced here for convenience. B) Cranial sparing was observed, such that when brain weights were expressed as a percentage of total body weight Dlk1 +/p mice had proportionately enlarged brains in comparison to mice of all other genotypes. Conversely, the brains of Grb10 m/+ and Grb10 m/+ /Dlk1 +/p animals were proportionately reduced in size compared to wild type and Dlk1 +/p mice (though note, not significantly so in the case of Grb10 m/+ /Dlk1 +/p versus wild type animals). C) Grb10 m/+ and Grb10 m/+ /Dlk1 +/p mice had disproportionally overgrown livers when compared to wild type and Dlk1 +/p animals. D) Kidney sparing was seen in both Grb10 m/+ and Grb10 m/+ /Dlk1 +/p animals compared to wild type and Dlk1 +/p mice. Conversely, kidney weight was proportionately increased in Dlk1 +/p animals compared with mice of all other genotypes (though note, not significantly so in the case of Dlk1 +/p versus wild type animals). E) Overgrowth of lungs was noted in Dlk1 +/p mice compared to wild type mice. F) Proportionate growth of hearts was seen in all the analysed genotypes. G) Table summarising results of statistical analysis. All values represent means ± SEM, analysed using one way ANOVA with Tukey’s post-hoc analysis. WT n = 19, Dlk1 +/p n = 36, Grb10 m/+ n = 23, Grb10 m/+ /Dlk1 +/p n = 22; * P <0.05; ** P <0.01; *** P <0.001. ANOVA, analysis of variance; SEM, standard error of the mean; WT, wild type.
Figure 5
Figure 5
Whole body, liver wet weight and relative liver weight analysis of one-week-old mice. A) Significantly increased body weights were noted in Grb10 m/+ compared to wild type and Dlk1 +/p and in Grb10 m/+ /Dlk1 +/p compared to Dlk1 +/p mice whereas weights of Dlk1 +/p animals did not differ from wild types. B) Analysis of wet weights of the livers revealed significant enlargement in Grb10 m/+ compared to wild type and Dlk1 +/p mice and in Grb10 m/+ /Dlk1 +/p compared to Dlk1 +/p animals. C) No differences were found in relative liver weights. D) Table summarising results of statistical analysis. All values represent means ± SEM, analysed using one way ANOVA with Tukey’s post-hoc analysis. WT n = 10, Dlk1 +/p n = 9, Grb10 m/+ n = 15, Grb10 m/+ /Dlk1 +/p n = 8; * P <0.05; *** P <0.001. ANOVA, analysis of variance; SEM, standard error of the mean; WT, wild type.
Figure 6
Figure 6
Histology of neonatal and adult livers stained with Oil Red O. A) An increased number of lipid droplets was observed in cryosectioned Grb10 m/+ and Grb10 m/+ /Dlk1 +/p neonatal livers following Oil Red O staining. B) An increased number of lipid droplets was observed in Oil Red O stained adult livers from Dlk1 +/p knockout mice. Images presented in Panels A and B show representative sections for each of the analysed genotypes. C) Quantification of histological sections (from three individuals for each genotype) of neonatal liver stained with Oil red O (percentage of area stained), showing increased staining for both Grb10 m/+ and Grb10 m/+ /Dlk1 +/p livers. D) Table summarising results of statistical analysis of data in C. All values represent means ± SEM and have been subject to one way ANOVA with post hoc Tukey’s analysis. WT n = 3, Dlk1 +/p n = 3, Grb10 m/+ n = 3 and Grb10 m/+ /Dlk1 +/p n = 3; ** P <0.01, ***P <0.001. ANOVA, analysis of variance; SEM, standard error of the mean; WT, wild type.
Figure 7
Figure 7
DXA analysis of male mice and levels of triglycerides in serum. Carcasses of male animals three- to nine-months old were subject to body composition analysis by Dual X-ray absorptiometry (DXA). No differences were seen in: A) bone mineral density (BMD); or B) bone mineral content (BMC). C) Total lean tissue mass was significantly elevated in Grb10 m/+ animals when compared to wild type and Dlk1 +/p mice and in Grb10 m/+ /Dlk1 +/p animals when compared to Dlk1 +/p . D) No differences were observed in total fat tissue content. E) Lean mass as a percentage of total body mass was significantly increased in Grb10 m/+ mice in comparison to Dlk1 +/p mice. F) Fat mass as a percentage of total body mass was significantly reduced in Grb10 m/+ mice in comparison to Dlk1 +/p mice. G) Table summarising results of statistical analysis of data in A-F. All values represent means ± SEM and have been subject to one way ANOVA with post hoc Tukey’s analysis. WT n = 14, Dlk1 +/p =12, Grb10 m/+ n = 12 and Grb10 m/+ /Dlk1 +/p n = 12; * P <0.05; ** P <0.01; *** P <0.001. H) Triglyceride levels in blood serum measured in three-month-old male mice. Dlk1 +/p mice were found to have significantly elevated levels of triglycerides in blood serum in comparison to Grb10 m/+. I) Table summarising results of statistical analysis of data in H. All values represent means ± SEM and have been subject to one way ANOVA with post hoc Tukey’s analysis. WT n = 6, Dlk1 +/p n = 6, Grb10 m/+ n = 6 and Grb10 m/+ /Dlk1 +/p n = 6; * P <0.05. ANOVA, analysis of variance; SEM, standard error of the mean; WT, wild type.
Figure 8
Figure 8
Glucose tolerance in male and female adult mice. Mice at three- to nine-months old were examined for their ability to clear a glucose load. Glucose clearance over time is presented graphically for males (A) and females (B). Analysis of the area under each of the glucose concentration curves revealed that Grb10 m/+ and Grb10 m/+ /Dlk1 +/p mice of both males (C) and females (D) cleared glucose significantly faster than Dlk1 +/p animals. E) Table summarising results of statistical analysis. All values represent means ± SEM and have been subject to one way ANOVA with post hoc Tukey’s analysis. Males: WT n = 14, Dlk1 +/p n = 12, Grb10 m/+ n = 12 and Grb10 m/+ /Dlk1 +/p n = 13; females: WT n = 13, Dlk1 +/p n = 12, Grb10 m/+ n = 12 and Grb10 m/+ /Dlk1 +/p n = 12; ** P <0.01. ANOVA, analysis of variance; SEM, standard error of the mean; WT, wild type.
Figure 9
Figure 9
Histological and morphometric analyses of neonatal lungs. A) Thickened epithelial walls were observed in Grb10 m/+ and Grb10 m/+ /Dlk1 +/p lungs, while Dlk1 +/p lungs displayed normal histology when compared to wild type littermates. The presented images are representative sections for each of the analysed genotypes (100x magnification). B) These observations were confirmed by morphometric analysis of epithelial wall thickness using images captured at 200x magnification. C) Table summarising results of statistical analysis of morphometric data. All values represent means ± SEM, analysed using one way ANOVA with Tukey’s post-hoc analysis. WT n = 5, Dlk1 +/p n = 5, Grb10 m/+ n = 5 and Grb10 m/+ /Dlk1 +/p n = 5; * P <0.05; *** P <0.001. ANOVA, analysis of variance; SEM, standard error of the mean; WT, wild type.
Figure 10
Figure 10
Model of the genetic interaction between Dlk1 and Grb10 . Normal growth is observed only in wild type animals, with intact Grb10 and Dlk1 genes. Gene knockout (indicated by an ‘X’ over the relevant genotypes) of maternal Grb1O (Grb10 m/+mice) results in overgrowth, whereas knockout of paternal Dlk1 (Dlk1 +/p mice) results in growth restriction. Simultaneous knockout of both genes (Grb10 m/+ /Dlk1 +/p mice) results in overgrowth, with associated changes in body proportions, histology and physiology, essentially as in Grb10 m/+ mice. Thus, Grb10 is an inhibitor of fetal growth while Dlk1 acts to promote growth by inhibition of Grb10.

Comment in

Similar articles

Cited by

References

    1. Raff MC. Size control: the regulation of cell numbers in animal development. Cell. 1996;86:173–175. doi: 10.1016/S0092-8674(00)80087-2. - DOI - PubMed
    1. Slack JM. Growth control: action mouse. Curr Biol. 1997;7:R467–R469. doi: 10.1016/S0960-9822(06)00238-7. - DOI - PubMed
    1. Hafen E, Stocker H. How are the sizes of cells, organs, and bodies controlled? PLoS Biol. 2003;1:E6. doi: 10.1371/journal.pbio.0000086. - DOI - PMC - PubMed
    1. Stanger BZ. Organ size determination and the limits of regulation. Cell Cycle. 2008;7:318–324. doi: 10.4161/cc.7.3.5348. - DOI - PubMed
    1. Tumaneng K, Russell RC, Guan KL. Organ size control by Hippo and TOR pathways. Curr Biol. 2012;22:R368–R379. doi: 10.1016/j.cub.2012.03.003. - DOI - PMC - PubMed

Publication types

MeSH terms

LinkOut - more resources