

Meta-analysis of prostate cancer gene expression data identifies a novel discriminatory signature enriched for glycosylating enzymes
- PMID: 25551447
- PMCID: PMC4351903
- DOI: 10.1186/s12920-014-0074-9
Meta-analysis of prostate cancer gene expression data identifies a novel discriminatory signature enriched for glycosylating enzymes
Abstract
Background: Tumorigenesis is characterised by changes in transcriptional control. Extensive transcript expression data have been acquired over the last decade and used to classify prostate cancers. Prostate cancer is, however, a heterogeneous multifocal cancer and this poses challenges in identifying robust transcript biomarkers.
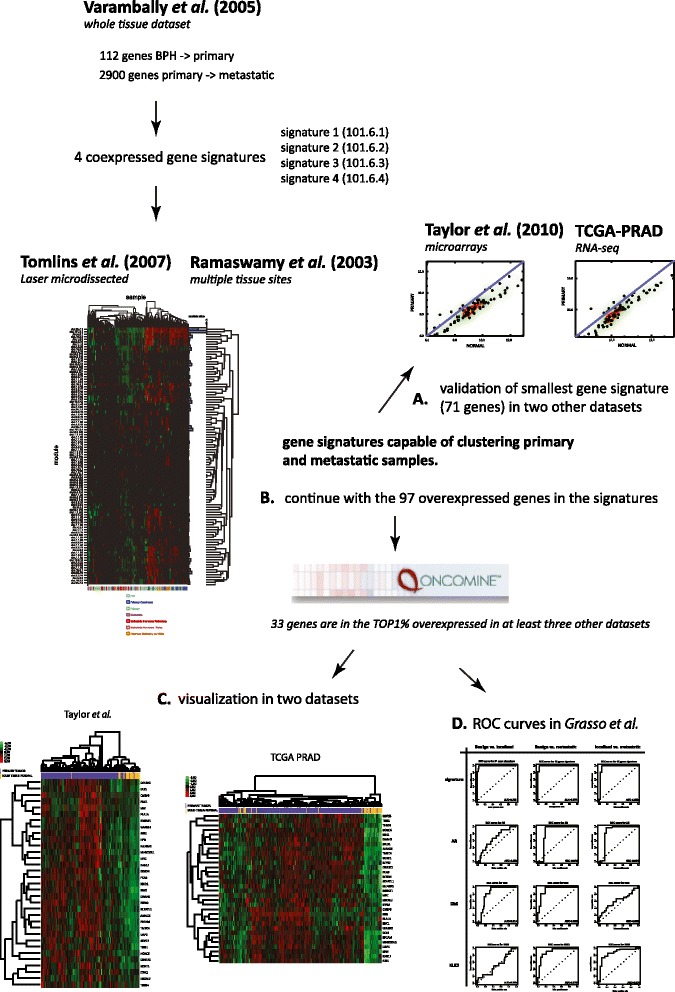
Methods: In this study, we have undertaken a meta-analysis of publicly available transcriptomic data spanning datasets and technologies from the last decade and encompassing laser capture microdissected and macrodissected sample sets.
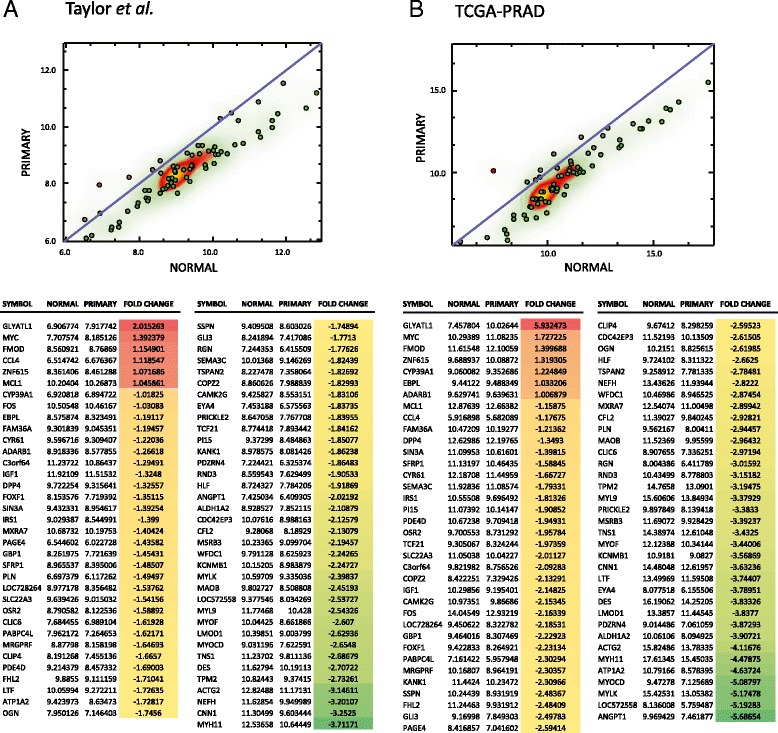
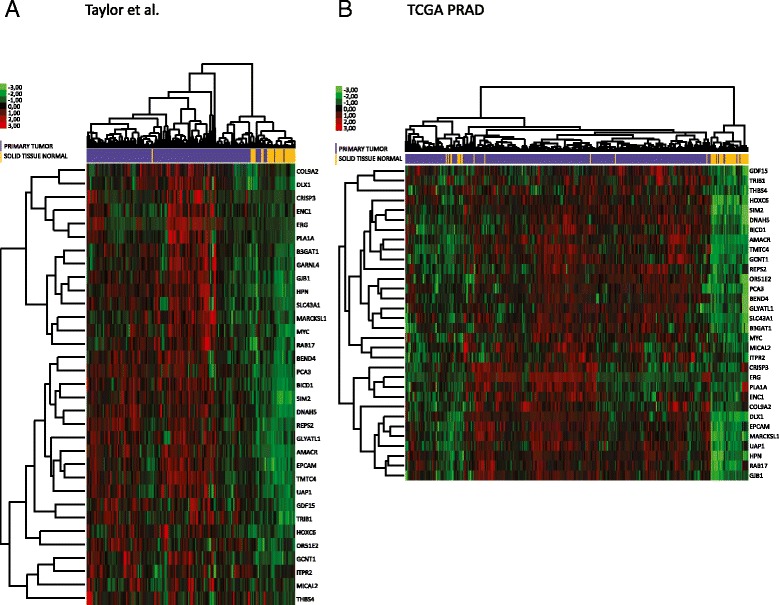
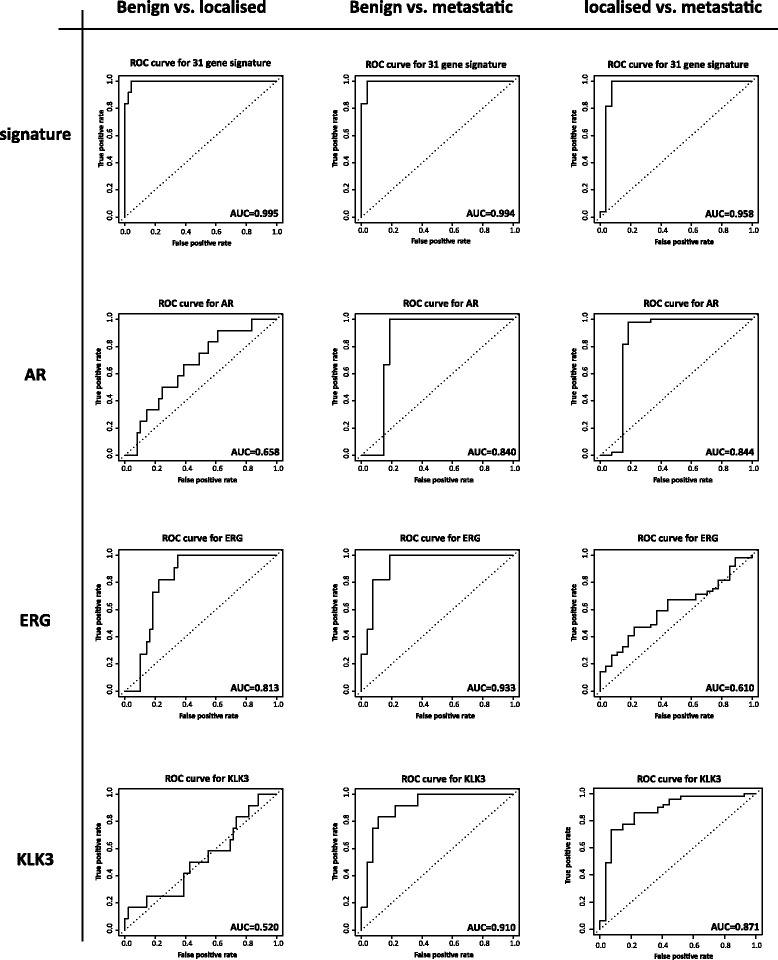
Results: We identified a 33 gene signature that can discriminate between benign tissue controls and localised prostate cancers irrespective of detection platform or dissection status. These genes were significantly overexpressed in localised prostate cancer versus benign tissue in at least three datasets within the Oncomine Compendium of Expression Array Data. In addition, they were also overexpressed in a recent exon-array dataset as well a prostate cancer RNA-seq dataset generated as part of the The Cancer Genomics Atlas (TCGA) initiative. Biologically, glycosylation was the single enriched process associated with this 33 gene signature, encompassing four glycosylating enzymes. We went on to evaluate the performance of this signature against three individual markers of prostate cancer, v-ets avian erythroblastosis virus E26 oncogene homolog (ERG) expression, prostate specific antigen (PSA) expression and androgen receptor (AR) expression in an additional independent dataset. Our signature had greater discriminatory power than these markers both for localised cancer and metastatic disease relative to benign tissue, or in the case of metastasis, also localised prostate cancer.
Conclusion: In conclusion, robust transcript biomarkers are present within datasets assembled over many years and cohorts and our study provides both examples and a strategy for refining and comparing datasets to obtain additional markers as more data are generated.
Figures
Similar articles
-
Quantitative RT-PCR analysis of estrogen receptor gene expression in laser microdissected prostate cancer tissue.Prostate. 2009 Jun 1;69(8):810-9. doi: 10.1002/pros.20929. Prostate. 2009. PMID: 19189301
-
Expression and regulation of prostate androgen regulated transcript-1 (PART-1) and identification of differential expression in prostatic cancer.Br J Cancer. 2001 Aug 3;85(3):393-7. doi: 10.1054/bjoc.2001.1883. Br J Cancer. 2001. PMID: 11487271 Free PMC article.
-
Genomic strategy for targeting therapy in castration-resistant prostate cancer.J Clin Oncol. 2009 Apr 20;27(12):2022-9. doi: 10.1200/JCO.2008.17.2882. Epub 2009 Mar 16. J Clin Oncol. 2009. PMID: 19289629
-
The discovery of common recurrent transmembrane protease serine 2 (TMPRSS2)-erythroblastosis virus E26 transforming sequence (ETS) gene fusions in prostate cancer: significance and clinical implications.Adv Anat Pathol. 2009 May;16(3):145-53. doi: 10.1097/PAP.0b013e3181a12da7. Adv Anat Pathol. 2009. PMID: 19395877 Review.
-
ETS gene fusions in prostate cancer: from discovery to daily clinical practice.Eur Urol. 2009 Aug;56(2):275-86. doi: 10.1016/j.eururo.2009.04.036. Epub 2009 Apr 24. Eur Urol. 2009. PMID: 19409690 Review.
Cited by
-
Multifaceted regulation and functions of replication factor C family in human cancers.Am J Cancer Res. 2018 Aug 1;8(8):1343-1355. eCollection 2018. Am J Cancer Res. 2018. PMID: 30210909 Free PMC article. Review.
-
c-Myc Antagonises the Transcriptional Activity of the Androgen Receptor in Prostate Cancer Affecting Key Gene Networks.EBioMedicine. 2017 Apr;18:83-93. doi: 10.1016/j.ebiom.2017.04.006. Epub 2017 Apr 5. EBioMedicine. 2017. PMID: 28412251 Free PMC article.
-
High Expression of SRSF10 Promotes Colorectal Cancer Progression by Aberrant Alternative Splicing of RFC5.Technol Cancer Res Treat. 2024 Jan-Dec;23:15330338241271906. doi: 10.1177/15330338241271906. Technol Cancer Res Treat. 2024. PMID: 39110418 Free PMC article.
-
The androgen receptor controls expression of the cancer-associated sTn antigen and cell adhesion through induction of ST6GalNAc1 in prostate cancer.Oncotarget. 2015 Oct 27;6(33):34358-74. doi: 10.18632/oncotarget.6024. Oncotarget. 2015. PMID: 26452038 Free PMC article.
-
RFC4 promotes the progression and growth of Oral Tongue squamous cell carcinoma in vivo and vitro.J Clin Lab Anal. 2021 May;35(5):e23761. doi: 10.1002/jcla.23761. Epub 2021 Mar 30. J Clin Lab Anal. 2021. PMID: 33783864 Free PMC article.
References
-
- Rhodes DR, Yu J, Shanker K, Deshpande N, Varambally R, Ghosh D, Barrette T, Pandey A, Chinnaiyan AM. Large-scale meta-analysis of cancer microarray data identifies common transcriptional profiles of neoplastic transformation and progression. Proc Natl Acad Sci U S A. 2004;101:9309–9314. doi: 10.1073/pnas.0401994101. - DOI - PMC - PubMed
-
- Horvath S, Zhang B, Carlson M, Lu KV, Zhu S, Felciano RM, Laurance MF, Zhao W, Qi S, Chen Z, Lee Y, Scheck AC, Liau LM, Wu H, Geschwind DH, Febbo PG, Kornblum HI, Cloughesy TF, Nelson SF, Mischel PS. Analysis of oncogenic signaling networks in glioblastoma identifies ASPM as a molecular target. Proc Natl Acad Sci U S A. 2006;103:17402–17407. doi: 10.1073/pnas.0608396103. - DOI - PMC - PubMed
-
- Stuart RO, Wachsman W, Berry CC, Wang-Rodriguez J, Wasserman L, Klacansky I, Masys D, Arden K, Goodison S, McClelland M, Wang Y, Sawyers A, Kalcheva I, Tarin D, Mercola D. In silico dissection of cell-type-associated patterns of gene expression in prostate cancer. Proc Natl Acad Sci USA. 2004;101:615–620. doi: 10.1073/pnas.2536479100. - DOI - PMC - PubMed
Publication types
MeSH terms
Substances
Grants and funding
LinkOut - more resources
Full Text Sources
Other Literature Sources
Medical
Research Materials
Miscellaneous
