

Oncostatin M maintains the hematopoietic microenvironment in the bone marrow by modulating adipogenesis and osteogenesis
- PMID: 25551451
- PMCID: PMC4281151
- DOI: 10.1371/journal.pone.0116209
Oncostatin M maintains the hematopoietic microenvironment in the bone marrow by modulating adipogenesis and osteogenesis
Abstract
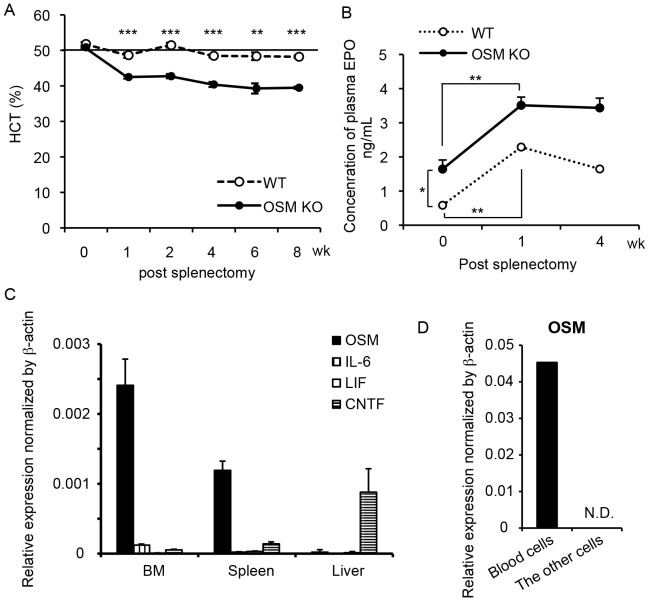
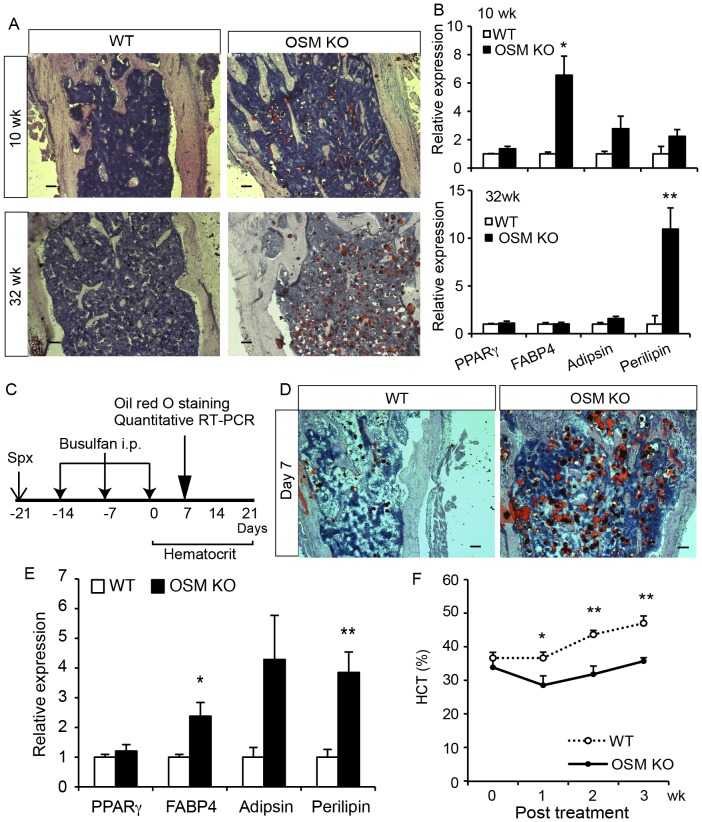
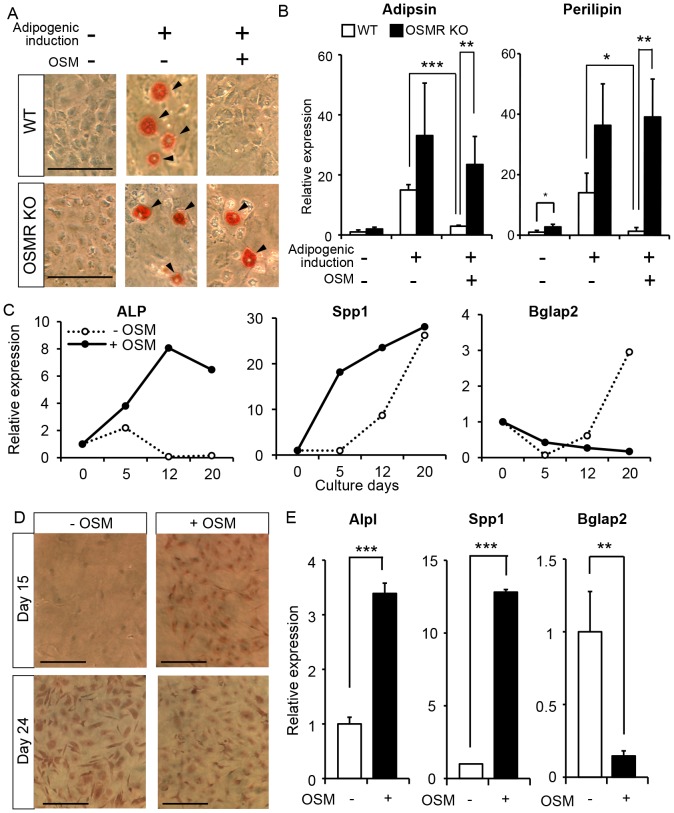
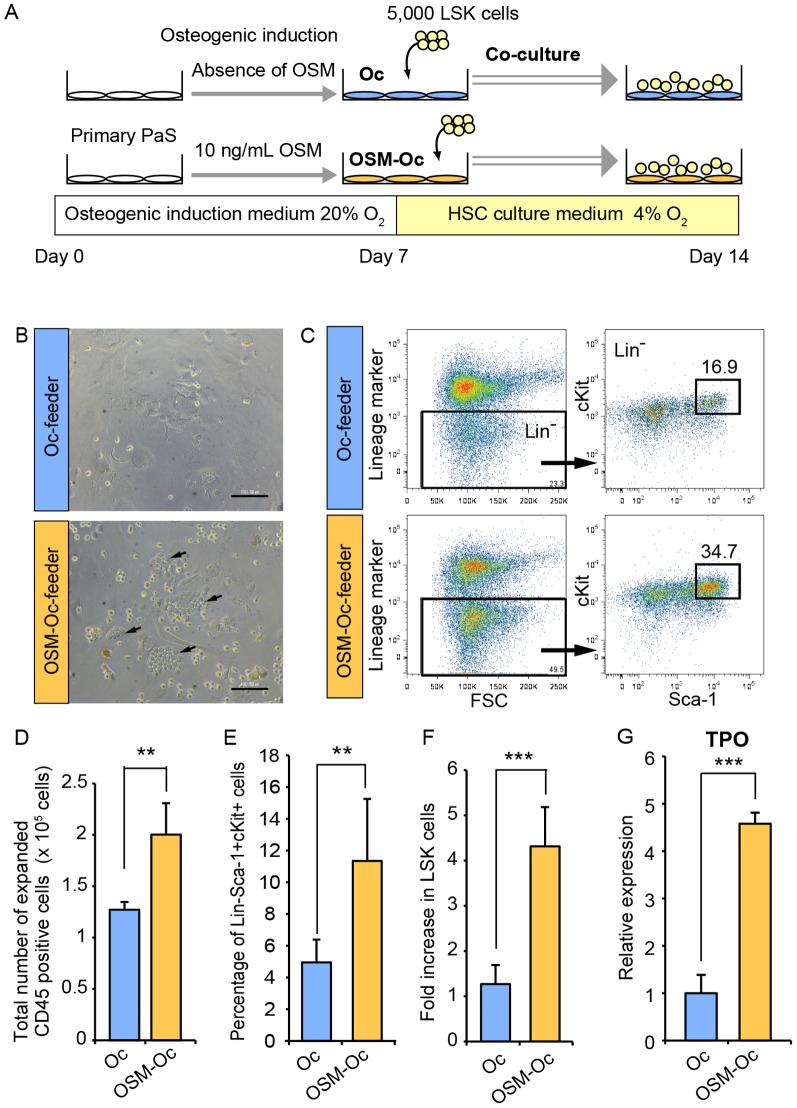
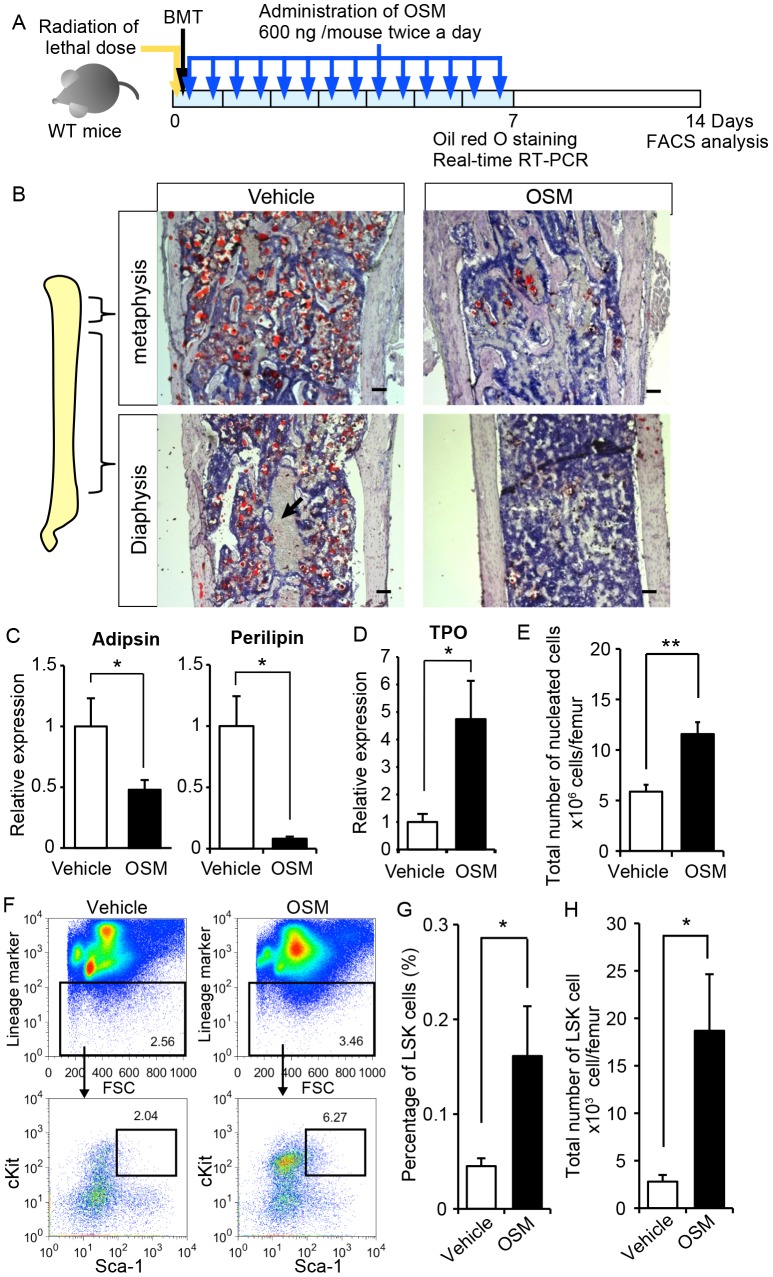
The bone marrow (BM) is an essential organ for hematopoiesis in adult, in which proliferation and differentiation of hematopoietic stem/progenitor cells (HSPC) is orchestrated by various stromal cells. Alterations of BM hematopoietic environment lead to various hematopoietic disorders as exemplified by the linking of fatty marrow with increased adipogenesis to anemia or pancytopenia. Therefore, the composition of mesenchymal stromal cell (MSC)-derived cells in the BM could be crucial for proper hematopoiesis, but the mechanisms underlying the MSC differentiation for hematopoiesis remain poorly understood. In this study, we show that Oncostatin M (OSM) knock out mice exhibited pancytopenia advancing fatty marrow with age. OSM strongly inhibited adipogenesis from BM MSC in vitro, whereas it enhanced their osteogenesis but suppressed the terminal differentiation. Intriguingly, OSM allowed the MSC-derived cells to support the ex vivo expansion of HSPC effectively as feeder cells. Furthermore, the administration of OSM in lethally irradiated wild-type mice blocked fatty marrow and enhanced the recovery of HSPC number in the BM and peripheral blood cells after engraftment of HSPC. Collectively, OSM plays multiple critical roles in the maintenance and development of the hematopoietic microenvironment in the BM at a steady state as well as after injury.
Conflict of interest statement
Figures

Similar articles
-
Oncostatin m maintains the hematopoietic microenvironment and retains hematopoietic progenitors in the bone marrow.Int J Hematol. 2006 Nov;84(4):319-27. doi: 10.1532/IJH97.06090. Int J Hematol. 2006. PMID: 17118758
-
Oncostatin m regulates mesenchymal cell differentiation and enhances hematopoietic supportive activity of bone marrow stromal cell lines.In Vitro Cell Dev Biol Anim. 2001 Nov-Dec;37(10):698-704. doi: 10.1290/1071-2690(2001)037<0698:OMRMCD>2.0.CO;2. In Vitro Cell Dev Biol Anim. 2001. PMID: 11776976
-
Early osteoinductive human bone marrow mesenchymal stromal/stem cells support an enhanced hematopoietic cell expansion with altered chemotaxis- and adhesion-related gene expression profiles.Biochem Biophys Res Commun. 2016 Jan 22;469(4):823-9. doi: 10.1016/j.bbrc.2015.12.061. Epub 2015 Dec 18. Biochem Biophys Res Commun. 2016. PMID: 26707642
-
Oncostatin M: Dual Regulator of the Skeletal and Hematopoietic Systems.Curr Osteoporos Rep. 2024 Feb;22(1):80-95. doi: 10.1007/s11914-023-00837-z. Epub 2024 Jan 10. Curr Osteoporos Rep. 2024. PMID: 38198032 Free PMC article. Review.
-
From Marrow to Bone and Fat: Exploring the Multifaceted Roles of Leptin Receptor Positive Bone Marrow Mesenchymal Stromal Cells.Cells. 2024 May 24;13(11):910. doi: 10.3390/cells13110910. Cells. 2024. PMID: 38891042 Free PMC article. Review.
Cited by
-
Relationship of HIF‑1α expression with apoptosis and cell cycle in bone marrow mesenchymal stem cells from patients with myelodysplastic syndrome.Mol Med Rep. 2022 Jul;26(1):239. doi: 10.3892/mmr.2022.12755. Epub 2022 Jun 1. Mol Med Rep. 2022. PMID: 35642674 Free PMC article.
-
Oncostatin M, an Underestimated Player in the Central Nervous System.Front Immunol. 2019 May 29;10:1165. doi: 10.3389/fimmu.2019.01165. eCollection 2019. Front Immunol. 2019. PMID: 31191538 Free PMC article. Review.
-
Oncostatin M and Kit-Ligand Control Hematopoietic Stem Cell Fate during Zebrafish Embryogenesis.Stem Cell Reports. 2018 Jun 5;10(6):1920-1934. doi: 10.1016/j.stemcr.2018.04.016. Epub 2018 May 17. Stem Cell Reports. 2018. PMID: 29779898 Free PMC article.
-
Soluble Factors on Stage to Direct Mesenchymal Stem Cells Fate.Front Bioeng Biotechnol. 2017 May 17;5:32. doi: 10.3389/fbioe.2017.00032. eCollection 2017. Front Bioeng Biotechnol. 2017. PMID: 28567372 Free PMC article. Review.
-
Oncostatin M regulates hematopoietic stem cell (HSC) niches in the bone marrow to restrict HSC mobilization.Leukemia. 2022 Feb;36(2):333-347. doi: 10.1038/s41375-021-01413-z. Epub 2021 Sep 13. Leukemia. 2022. PMID: 34518644
References
-
- Calvi LM, Adams GB, Weibrecht KW, Weber JM, Olson DP, et al. (2003) Osteoblastic cells regulate the haematopoietic stem cell niche. Nature 425:841–846. - PubMed
-
- Zhang J, Niu C, Ye L, Huang H, He X, et al. (2003) Identification of the haematopoietic stem cell niche and control of the niche size. Nature 425:836–841. - PubMed
-
- Adams GB, Chabner KT, Alley IR, Olson DP, Szczepiorkowski ZM, et al. (2006) Stem cell engraftment at the endosteal niche is specified by the calcium-sensing receptor. Nature 439:599–603. - PubMed
-
- Kiel MJ, Yilmaz OH, Iwashita T, Yilmaz OH, Terhorst C, et al. (2005) SLAM family receptors distinguish hematopoietic stem and progenitor cells and reveal endothelial niches for stem cells. Cell 121:1109–1121. - PubMed
Publication types
MeSH terms
Substances
LinkOut - more resources
Full Text Sources
Other Literature Sources
Molecular Biology Databases
