. 2014 Dec 31;9(12):e115714.
doi: 10.1371/journal.pone.0115714. eCollection 2014.

Costs of eliminating malaria and the impact of the global fund in 34 countries

Affiliations

Costs of eliminating malaria and the impact of the global fund in 34 countries

Brittany Zelman et al. PLoS One. .

Abstract

Background: International financing for malaria increased more than 18-fold between 2000 and 2011; the largest source came from The Global Fund to Fight AIDS, Tuberculosis and Malaria (Global Fund). Countries have made substantial progress, but achieving elimination requires sustained finances to interrupt transmission and prevent reintroduction. Since 2011, global financing for malaria has declined, fueling concerns that further progress will be impeded, especially for current malaria-eliminating countries that may face resurgent malaria if programs are disrupted.

Objectives: This study aims to 1) assess past total and Global Fund funding to the 34 current malaria-eliminating countries, and 2) estimate their future funding needs to achieve malaria elimination and prevent reintroduction through 2030.

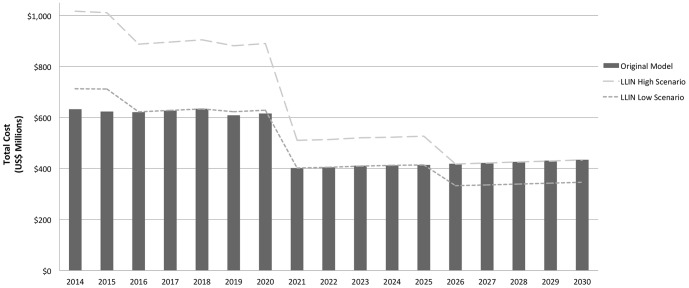
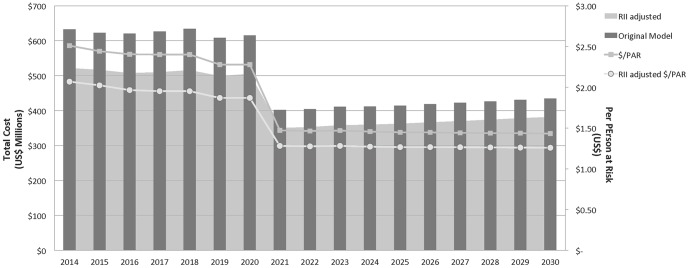
Methods: Historical funding is assessed against trends in country-level malaria annual parasite incidences (APIs) and income per capita. Following Kizewski et al. (2007), program costs to eliminate malaria and prevent reintroduction through 2030 are estimated using a deterministic model. The cost parameters are tailored to a package of interventions aimed at malaria elimination and prevention of reintroduction.

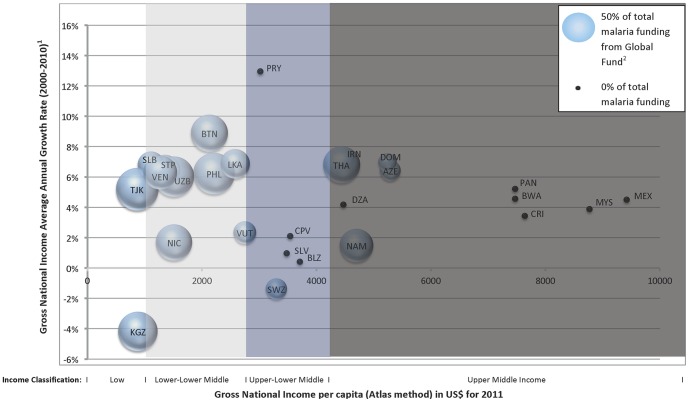
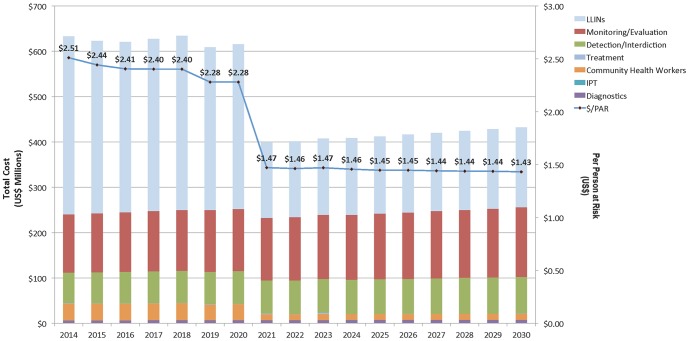
Results: The majority of Global Fund-supported countries experiencing increases in total funding from 2005 to 2010 coincided with reductions in malaria APIs and also overall GNI per capita average annual growth. The total amount of projected funding needed for the current malaria-eliminating countries to achieve elimination and prevent reintroduction through 2030 is approximately US$8.5 billion, or about $1.84 per person at risk per year (PPY) (ranging from $2.51 PPY in 2014 to $1.43 PPY in 2030).

Conclusions: Although external donor funding, particularly from the Global Fund, has been key for many malaria-eliminating countries, sustained and sufficient financing is critical for furthering global malaria elimination. Projected cost estimates for elimination provide policymakers with an indication of the level of financial resources that should be mobilized to achieve malaria elimination goals.


Conflict of interest statement

Competing Interests: Brittany Zelman has read the journal's policy and the authors of this manuscript have the following competing interests: BZ, CC, and JL work at the Global Health Group of the University of California San Francisco, San Francisco, CA, USA. The UCSF Global Health Group exists in part to support global, regional, and country efforts to achieve evidence-based malaria elimination. The findings and conclusions in this paper are those of the authors and do not necessarily represent the views of their employing organizations or of the sources of funding. This does not alter the authors' adherence to PLOS ONE policies on sharing data and materials.

Figures

Figure 1
Figure 1. Average annual growth rate in Gross National Income per capita between 2000 and 2010 by Gross National Income per capita for 2011.
Notes: The Global Fund income categories are based on the World Bank (Atlas Method) Income Classifications. Lower middle income countries are further divided into two groups: lower-lower middle income countries and upper-lower middle income countries based on the midpoint of the GNI per capita range of the lower middle income category. Classifications are as follows: low income, $1,025 or less; lower-lower middle income, $1,026–$2,530; upper-lower middle income $2,531–$4,035; upper middle income, $4,036–$12,475. GNI per capita average annual growth data for the Democratic People's Republic of Korea was unavailable. Data for China is unreliable, reporting 100% of malaria funding from the Global Fund, and therefore removed. High income countries—Korea, Saudi Arabia, and Turkey—are not shown. 1Data obtained from the World Bank. If information was not available for 2010, data from the most recent year available was used. 2Data taken from the World Health Organization's 2011 World Malaria Report Annex 2 for the period of 2005-2010, not including contributions reported by donors. Bubble legend to scale.
Figure 2
Figure 2. Estimated costs for malaria elimination and prevention of reintroduction in the 34 malaria-eliminating countries, 2014–2030.
Notes: The decrease in 2020 is due to a number of countries reaching their national target elimination years, at which time, based on our model assumptions, certain interventions cease (CHWs, LLINs). Other interventions, such as treatment continue, decline by reducing coverage levels per declining incidence. Estimated costs for 2021 to 2030 include all projected expenditures for maintaining elimination interventions thorough 2030 for DPRK, Iran, the Philippines, Thailand, Solomon Islands, Vanuatu, and Vietnam. This period also includes expenditures for prevention of reintroduction interventions among countries that have eliminated prior to 2021. Prices are in 2013 USD$.
Figure 3
Figure 3. LLIN adjusted costs to eliminate malaria in 34 countries, 2014–2030.
Notes: Higher LLIN estimates occur from 2014 to 2020 are associated with higher coverage rates for countries further from elimination years in both scenarios (80% for “high coverage scenario” and 50% for “low coverage scenario”). As elimination year nears, countries move into the next coverage tier of both scenarios (50% for “high coverage scenario” and 30% for “low coverage scenario”). For all endemic countries between the years of 2026 and 2030, coverage rates are at their lowest (30% for high coverage scenario and 15% for low coverage scenario).
Figure 4
Figure 4. Remoteness and Incapacity Indices (RII) adjusted costs to eliminate malaria in 34 countries, 2014–2030.
Estimated overall and per PAR costs from the original model are compared over time to RII adjusted costs. RII adjusted rates are about 15% lower than the original model.

Similar articles

Cited by

References

    1. Feachem RGA, Phillips AA, Hwang J, Cotter C, Wielgosz B, et al. (2010) Shrinking the malaria map: Progress and prospects. The Lancet 376(9752):1566–78. - PMC - PubMed
    1. Cotter C, Sturrock HJW, Hsiang MS, Liu J, Phillips AA, et al. (2013) The changing epidemiology of malaria elimination: New strategies for new challenges. The Lancet 382(9895):900–11. - PMC - PubMed
    1. World Health Organization (2012) World Malaria Report 2012. World Health Organization, Geneva, Swizterland.
    1. Pigott DM, Atun R, Moyes CL, Hay SI, Gething PW (2012) Funding for malaria control 2006–2010: A comprehensive global assessment. Malaria Journal 11(246). - PMC - PubMed
    1. Kumar K, Pigazzini A, Stenson B (2014) Financing Malaria Elimination. Cambridge Economic Policy Associates.

Publication types

MeSH terms