

Latexin inhibits the proliferation of CD133+ miapaca-2 pancreatic cancer stem-like cells
- PMID: 25551472
- PMCID: PMC4396164
- DOI: 10.1186/1477-7819-12-404
Latexin inhibits the proliferation of CD133+ miapaca-2 pancreatic cancer stem-like cells
Abstract
Background: An increasing number of evidence suggests that pancreatic cancer contains cancer stem cells (CSCs), which may be relevant to the resistance of chemotherapy. Latexin (Lxn) is a negative regulator of stem cell proliferation and we investigate the effects of Lxn on CD133+ pancreatic cancer stem-like cells.
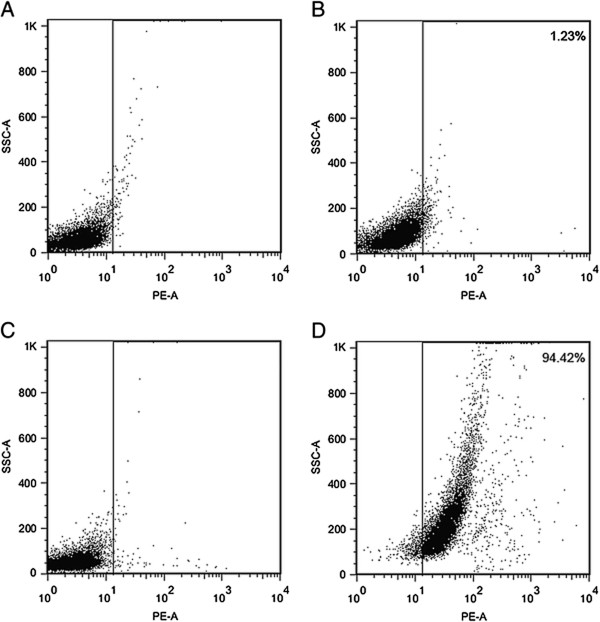
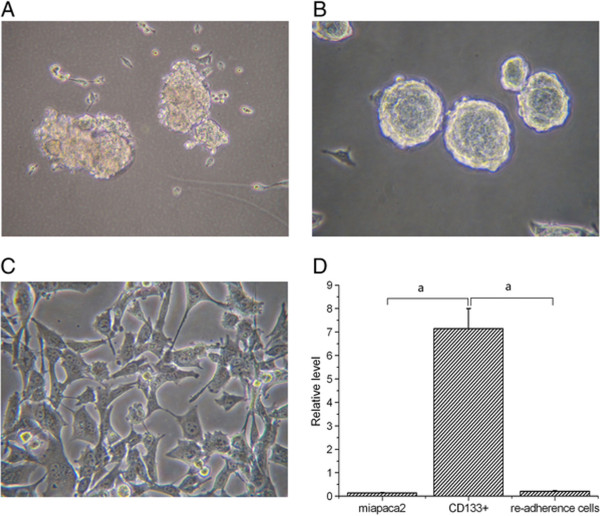
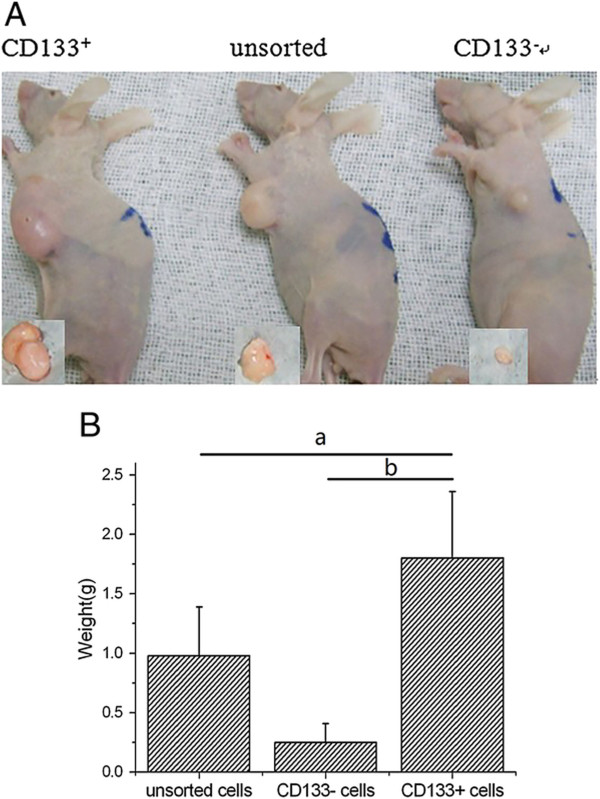
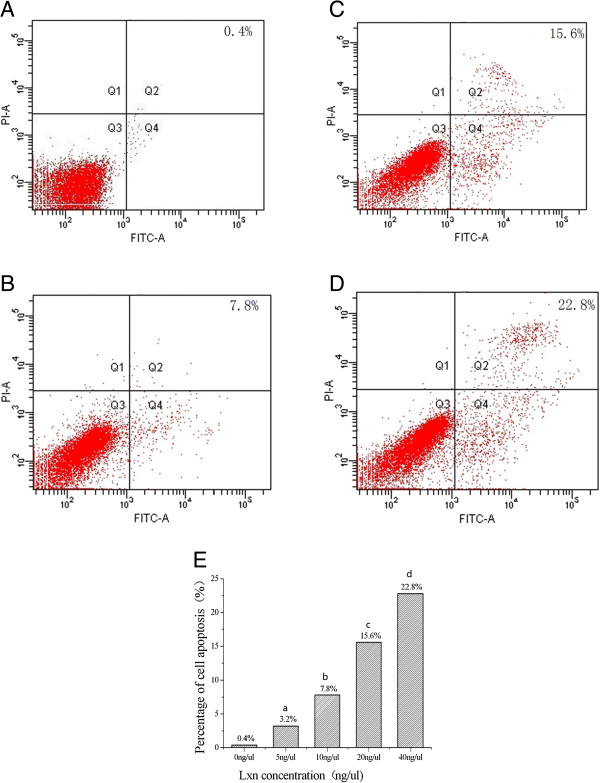
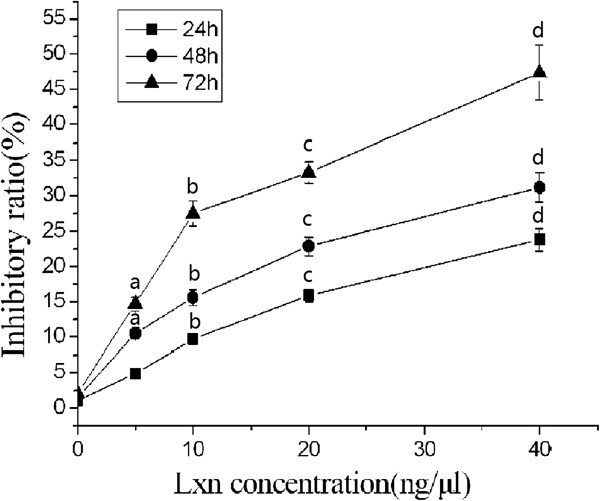
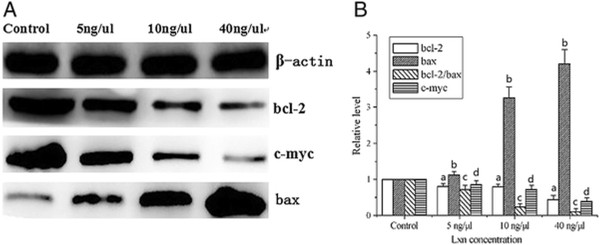
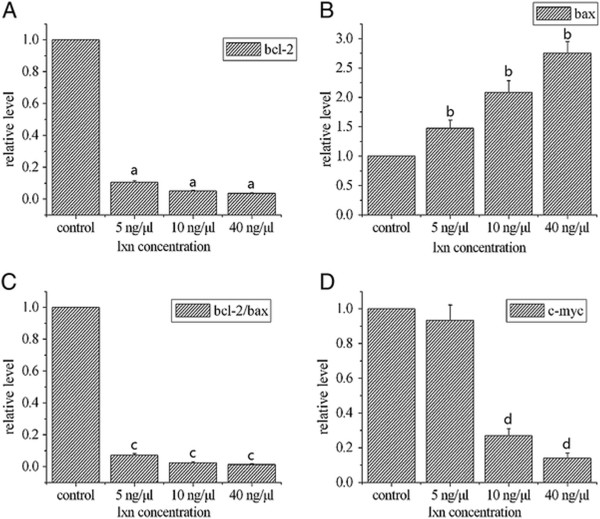
Methods: CD133+ miapaca-2 cells, a human pancreatic carcinoma cell line, were isolated and sorted by magnetic activated cell sorting and flow cytometry. The capacity for self-renewal, proliferation, and tumorigenicity of CD133+ miapaca-2 cells was determined by the floating spheres test and tumor xenograft assays. Protein and mRNA expression of Lxn in CD133+ and CD133- miapaca-2 cells were detected by Western blotting and qRT-PCR, respectively. After CD133+ miapaca-2 cells were treated with Lxn in serum-free medium (SFM), cell proliferation was assayed with a Cell Counting Kit 8 (CCK-8) and apoptosis was analyzed by flow cytometry. The protein and mRNA expression levels of Bcl-2, bax, and c-myc were also analyzed.
Results: We successfully isolated CD133+ miapaca-2 cells that exhibited the capacity for self-renewal in SFM, a proliferation potential in DMEM supplemented with FBS, and high tumorigenicity in nude mice. Lxn protein and mRNA expression levels in CD133+ miapaca-2 cells were significantly lower than those in CD133- cells. Lxn-treated CD133+ miapaca-2 cells exhibited increased apoptosis and low proliferation activity, down-regulation of Bcl-2 and c-myc expression, and up-regulation of Bax expression in a dose-dependent manner.
Conclusions: Lxn induces apoptosis and inhibits the proliferation of CD133+ miapaca-2 cells. These changes are associated with down-regulation of Bcl-2 and c-myc and up-regulation of Bax.
Figures

Similar articles
-
Establishment of pancreatic cancer stem cells by flow cytometry and their biological characteristics.Int J Clin Exp Pathol. 2015 Sep 1;8(9):11218-23. eCollection 2015. Int J Clin Exp Pathol. 2015. PMID: 26617845 Free PMC article.
-
Pancreatic cancer stem-like cells display aggressive behavior mediated via activation of FoxQ1.J Biol Chem. 2014 May 23;289(21):14520-33. doi: 10.1074/jbc.M113.532887. Epub 2014 Apr 9. J Biol Chem. 2014. PMID: 24719318 Free PMC article.
-
microRNA-150 inhibits human CD133-positive liver cancer stem cells through negative regulation of the transcription factor c-Myb.Int J Oncol. 2012 Mar;40(3):747-56. doi: 10.3892/ijo.2011.1242. Epub 2011 Oct 24. Int J Oncol. 2012. PMID: 22025269
-
CD133: holy of grail of neuro-oncology or promiscuous red-herring?Cell Prolif. 2012 Dec;45(6):527-37. doi: 10.1111/j.1365-2184.2012.00842.x. Cell Prolif. 2012. PMID: 23106300 Free PMC article. Review.
-
CD133: beyond a cancer stem cell biomarker.J Drug Target. 2019 Mar;27(3):257-269. doi: 10.1080/1061186X.2018.1479756. Epub 2018 Jul 17. J Drug Target. 2019. PMID: 29911902 Review.
Cited by
-
Neuropilin1 silencing impairs the proliferation and migration of cells in pancreatic cancer.J Clin Lab Anal. 2020 Sep;34(9):e23394. doi: 10.1002/jcla.23394. Epub 2020 May 30. J Clin Lab Anal. 2020. PMID: 32472711 Free PMC article.
-
A promising antitumor method: Targeting CSC with immune cells modified with CAR.Front Immunol. 2022 Aug 11;13:937327. doi: 10.3389/fimmu.2022.937327. eCollection 2022. Front Immunol. 2022. PMID: 36032145 Free PMC article. Review.
-
Latexin exhibits tumor-suppressor potential in pancreatic ductal adenocarcinoma.Oncol Rep. 2016 Jan;35(1):50-8. doi: 10.3892/or.2015.4353. Epub 2015 Oct 27. Oncol Rep. 2016. PMID: 26530530 Free PMC article.
-
Bmi-1 promotes the invasion and migration of colon cancer stem cells through the downregulation of E-cadherin.Int J Mol Med. 2016 Oct;38(4):1199-207. doi: 10.3892/ijmm.2016.2730. Epub 2016 Sep 7. Int J Mol Med. 2016. PMID: 27600678 Free PMC article.
-
Piwi-Interacting RNAs: A New Class of Regulator in Human Breast Cancer.Front Oncol. 2021 Jul 6;11:695077. doi: 10.3389/fonc.2021.695077. eCollection 2021. Front Oncol. 2021. PMID: 34295823 Free PMC article. Review.
References
-
- Philip PA, Mooney M, Jaffe D, Eckhardt G, Moore M, Meropol N, Emens L, O'Reilly E, Korc M, Ellis L, Benedetti J, Rothenberg M, Willett C, Tempero M, Lowy A, Abbruzzese J, Simeone D, Hingorani S, Berlin J, Tepper J. Consensus report of the national cancer institute clinical trials planning meeting on pancreas cancer treatment. J Clin Oncol. 2009;27:5660–5669. doi: 10.1200/JCO.2009.21.9022. - DOI - PMC - PubMed
Publication types
MeSH terms
Substances
LinkOut - more resources
Full Text Sources
Other Literature Sources
Medical
Research Materials
