. 2014 Dec 31;9(12):e116125.
doi: 10.1371/journal.pone.0116125. eCollection 2014.

The kidney transcriptome and proteome defined by transcriptomics and antibody-based profiling

Affiliations

The kidney transcriptome and proteome defined by transcriptomics and antibody-based profiling

Masato Habuka et al. PLoS One. .

Abstract

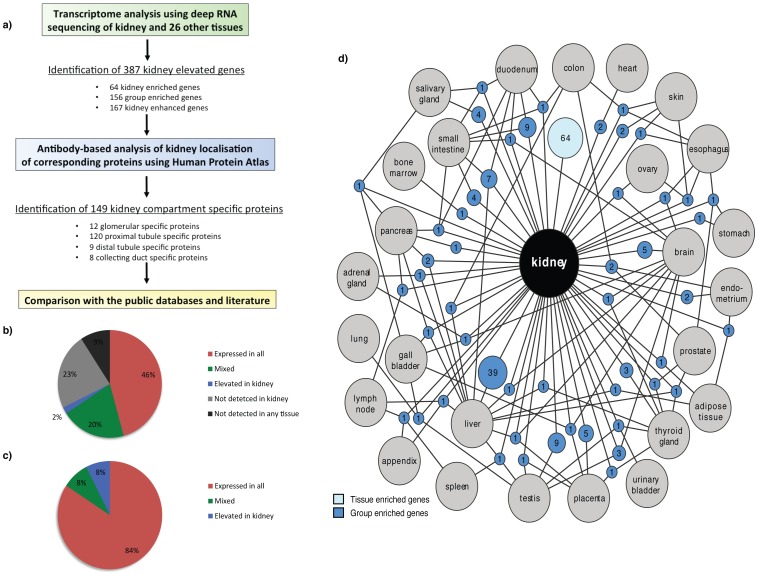
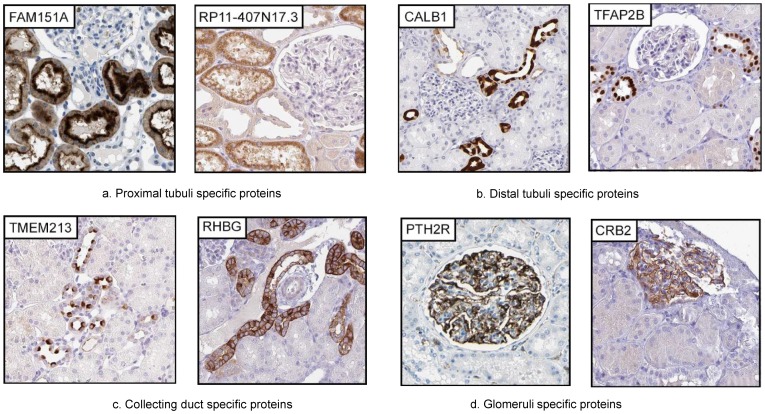
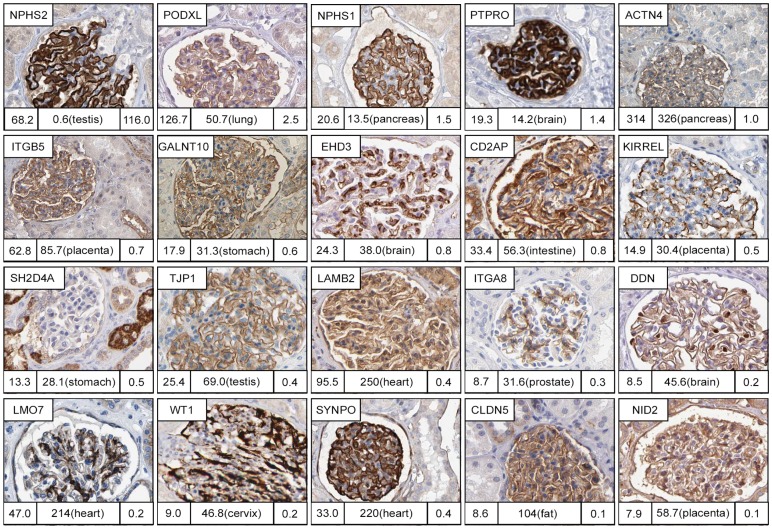
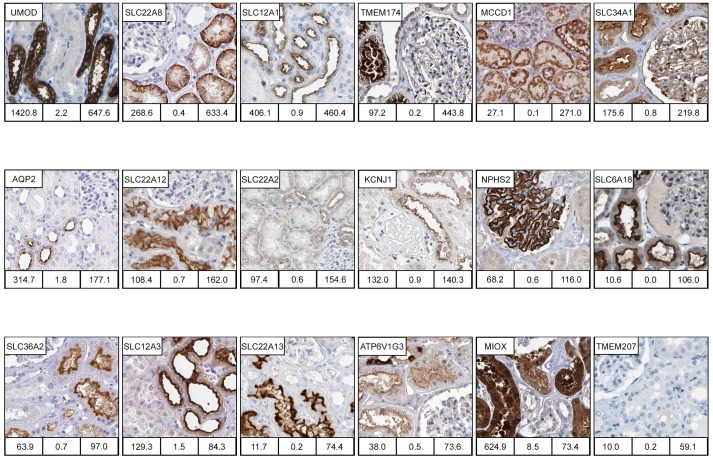
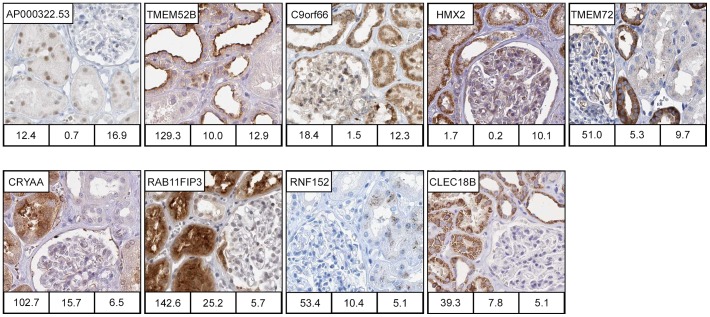
To understand renal functions and disease, it is important to define the molecular constituents of the various compartments of the kidney. Here, we used comparative transcriptomic analysis of all major organs and tissues in the human body, in combination with kidney tissue micro array based immunohistochemistry, to generate a comprehensive description of the kidney-specific transcriptome and proteome. A special emphasis was placed on the identification of genes and proteins that were elevated in specific kidney subcompartments. Our analysis identified close to 400 genes that had elevated expression in the kidney, as compared to the other analysed tissues, and these were further subdivided, depending on expression levels, into tissue enriched, group enriched or tissue enhanced. Immunohistochemistry allowed us to identify proteins with distinct localisation to the glomeruli (n = 11), proximal tubules (n = 120), distal tubules (n = 9) or collecting ducts (n = 8). Among the identified kidney elevated transcripts, we found several proteins not previously characterised or identified as elevated in kidney. This description of the kidney specific transcriptome and proteome provides a resource for basic and clinical research to facilitate studies to understand kidney biology and disease.


Conflict of interest statement

Competing Interests: The authors have declared that no competing interests exist.

Figures

Figure 1
Figure 1. Correlation and classifications of genes expressed in kidney in relation to gene expression in other tissues.
(a) Flow chart for the identification of kidney elevated genes and genes with unique localization to one nephron segment or collecting duct performed in this work. (b) Distribution of kidney expressed genes as the percentages of expressed mRNA molecules, i.e. the sum of all FPKM values for the genes expressed in kidney for each of the categories. (c) The classification of all human 20,050 protein coding genes divided in six different categories based on transcript abundance and number of detected tissues show 68% of human protein coding genes expressed in kidney. Colours in (b)-(c) represent six categories: not detected (grey), highly tissue enriched, moderately tissue enriched or group enriched (blue), tissue enhanced (dark blue), mixed (green), expressed in all low (red), expressed in all (dark red). (d) Network plot of the kidney enriched genes (light blue) and the group-enriched genes shared with ≤3 other tissues (dark blue). Blue circle nodes represent a shared group of expressed genes and are connected to the respective enriched tissues (grey circles). The size of each blue node is related to the square root of the number of genes enriched in a particular combination of tissues.
Figure 2
Figure 2. Proteins among the enriched/enhanced proteins localised to one specific nephron segment or collecting ducts.
Two examples of proteins specific for each segment (or two segments) are shown, with segment name below images. (A) Among genes restricted to proximal tubule only, FAM151A is localised to luminal side while RP-11-407N17.3 show a cytoplasmic staining. (B) In distal tubule, CALB1 show a non-uniform cytoplasmic localisation, while TFAP2B show a distinct nuclear localisation in most cells. (C) In the collecting duct, TMEM213 is found at the luminal membrane of intercalated cells only, while RHBG display a general membrane localisation in all cells. (D) PTH2R and CRB2 show a specific localisation to podocytes in glomeruli.
Figure 3
Figure 3. Reverse analysis of proteins previously characterised as glomeruli specific.
4 of 20 glomeruli specific proteins selected based on literature (NPHS2, PODXL, NPHS1 and PTPRO) are found in the group of kidney enriched/enhanced proteins when compared to RNAseq data for the 27 tissues. Furthermore, 6 of the 20 genes do not display a glomeruli-specific localisation within kidney (ITGB5, GALNT10, CD2AP, SH2D4A, LAMB2, CLDN5). Numbers under each IHC image correspond to mean FPKM in kidney (left bottom), Max FPKM in next most highly expressed tissue and the tissue name (middle bottom), and tissue specificity score in kidney (right bottom).
Figure 4
Figure 4. Examples of highly enriched kidney proteins.
Immunohistochemically (IHC) stained images of proteins selectively expressed in different subsets of cells and structures in kidney tissue. IHC images were available for 18 of the 20 highly enriched genes, and for 17 of the 18 genes the expression in kidney were confirmed, here ordered according to tissue specificity score in the figure. When ordered according to nephron segment, these are; glomeruli podocytes (NPHS2), proximal tubule cytoplasm (MIOX) and proximal tubule basolateral membrane (SLC22A8, SLC22A2) and proximal tubule luminal membrane (TMEM174, SLC34A1, SLC22A12, SLC6A18, SLC36A2 and SLC22A13), distal tubule cytoplasm (UMOD) and distal tubule luminal membrane (SLC12A1, KCNJ1, SLC12A3), and collecting duct luminal membrane (AQP2). MCCD1 localises the cytoplasm in cells of all tubular segments cytoplasm. ATP6V1G3 localises to luminal membrane of both proximal and distal tubule luminal membrane and with a strong cytoplasmic staining in intercalated cells in collecting duct. TMEM207 could not be confirmed as expressed in kidney in IHC images available in the Protein Atlas. Numbers under each IHC image correspond to mean FPKM in kidney (left bottom), max FPKM of the second most highly expressed tissue (middle bottom), and to Tissue specificity score (TS) in kidney (right bottom).
Figure 5
Figure 5. Kidney enriched proteins previously not described in kidney.
Immunohisto-chemically stained images of kidney enriched proteins (TS>5 FPKM) for which we found no previous description expression in kidney based searches in literatures or online databases (GeneCards, WikiGene, BioGPS). Of the 16 kidney enriched genes not described previously, IHC images confirming kidney specific localisation were available for 10 genes. In proximal tubule cells, AP000322.53 localise to the nucleus while TMEM52B, RAB11FIP3 and CRYAA show a general cytoplasmic staining, and RNF152 shows a granular cytoplasmic staining. In distal tubule, TMEM72 localises to the basolateral membrane. C9orf66 is found in all nephron segments but with different localisations. In glomeruli, it localise to the nucleus, in proximal tubular cells to nucleus and cytoplasm, while in cells in distal tubule and collecting duct only in cytoplasm. Both HMX2 and CLEC18B localises to the cytoplasm of cells in proximal and distal tubule, and also in the collecting duct, however for CLEC18B only in the intercalated cells. Numbers under each IHC image correspond to Mean FPKM in kidney (left bottom), Max FPKM in the tissue with 2nd most highly expressed level (middle bottom), and Tissue specificity score in kidney (right bottom).

References

    1. Kestila M, Lenkkeri U, Mannikko M, Lamerdin J, McCready P, et al. (1998) Positionally cloned gene for a novel glomerular protein–nephrin–is mutated in congenital nephrotic syndrome. Molecular cell 1:575–582. - PubMed
    1. Yamamoto T, Sasaki S (1998) Aquaporins in the kidney: emerging new aspects. Kidney international 54:1041–1051. - PubMed
    1. Schlessinger A, Yee SW, Sali A, Giacomini KM (2013) SLC classification: an update. Clinical pharmacology and therapeutics 94:19–23. - PMC - PubMed
    1. Morrissey KM, Wen CC, Johns SJ, Zhang L, Huang SM, et al. (2012) The UCSF-FDA TransPortal: a public drug transporter database. Clinical pharmacology and therapeutics 92:545–546. - PMC - PubMed
    1. Takemoto M, He L, Norlin J, Patrakka J, Xiao Z, et al. (2006) Large-scale identification of genes implicated in kidney glomerulus development and function. The EMBO journal 25:1160–1174. - PMC - PubMed

Publication types

LinkOut - more resources