. 2015 Mar 1;308(5):H485-99.
doi: 10.1152/ajpheart.00257.2014. Epub 2014 Dec 30.

Mitochondrial depolarization and asystole in the globally ischemic rabbit heart: coordinated response to interventions affecting energy balance

Affiliations

Mitochondrial depolarization and asystole in the globally ischemic rabbit heart: coordinated response to interventions affecting energy balance

Paul W Venable et al. Am J Physiol Heart Circ Physiol. .

Abstract

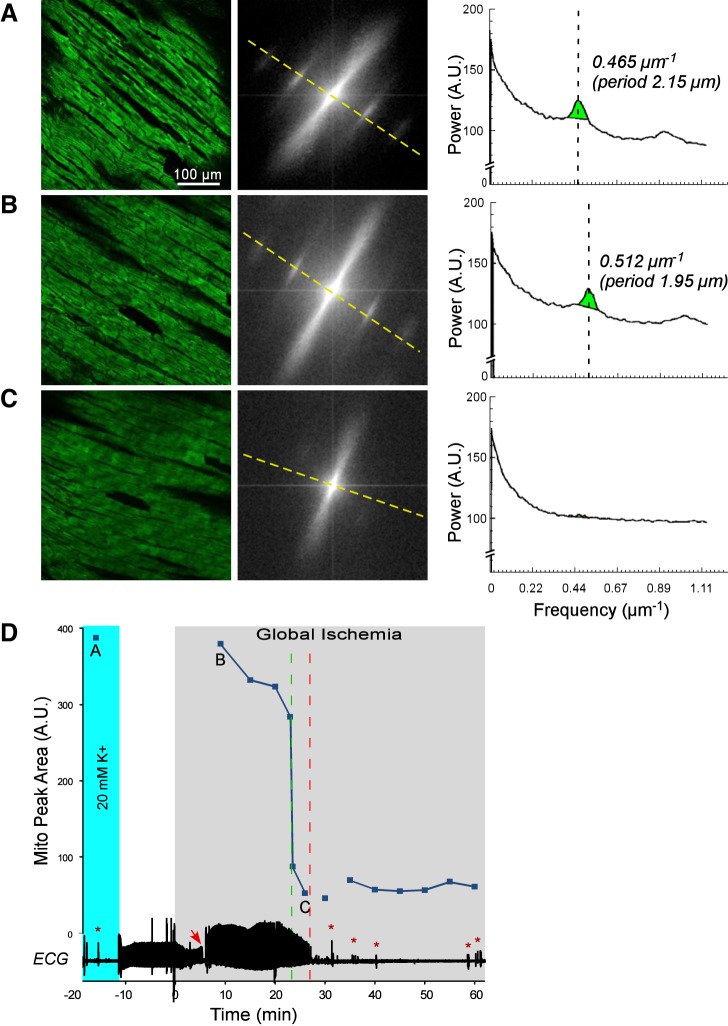
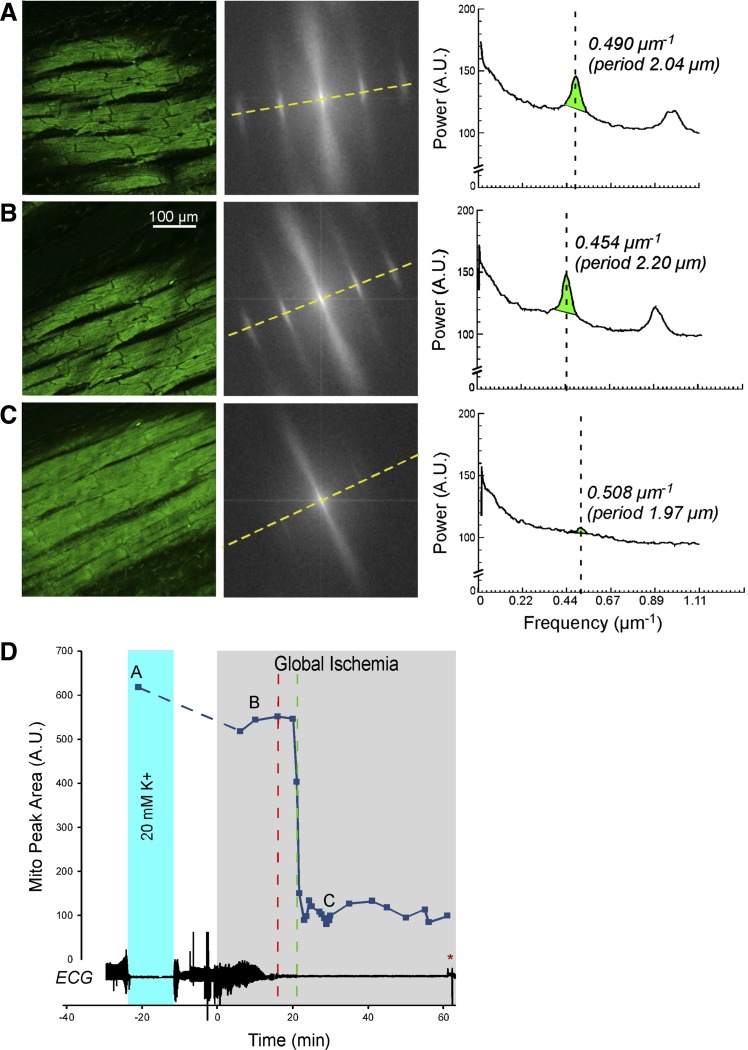
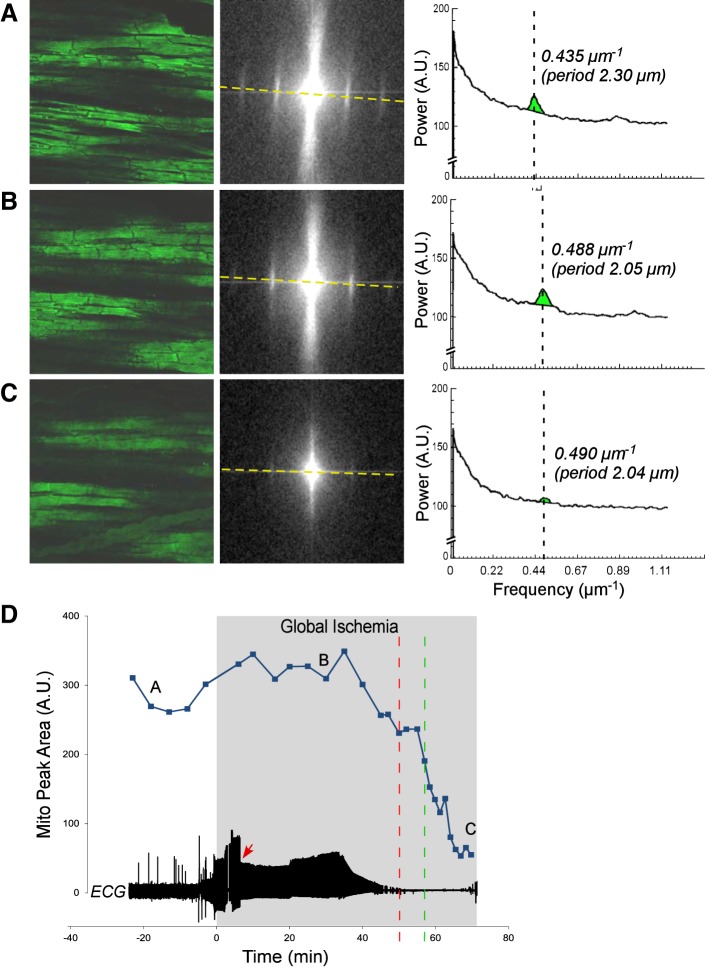
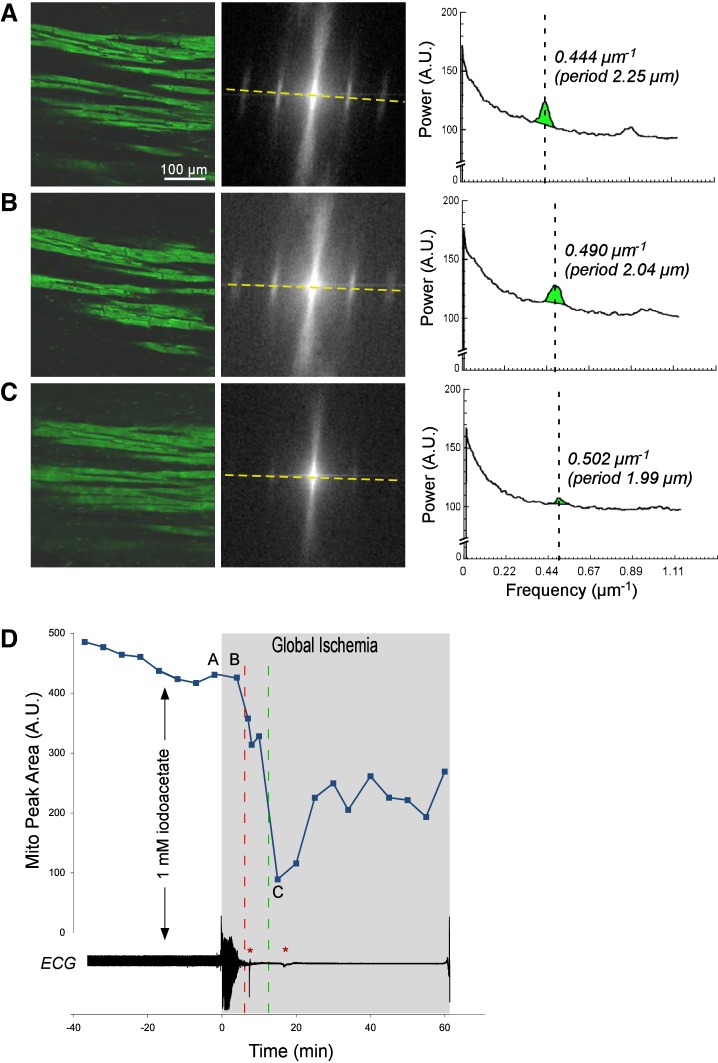
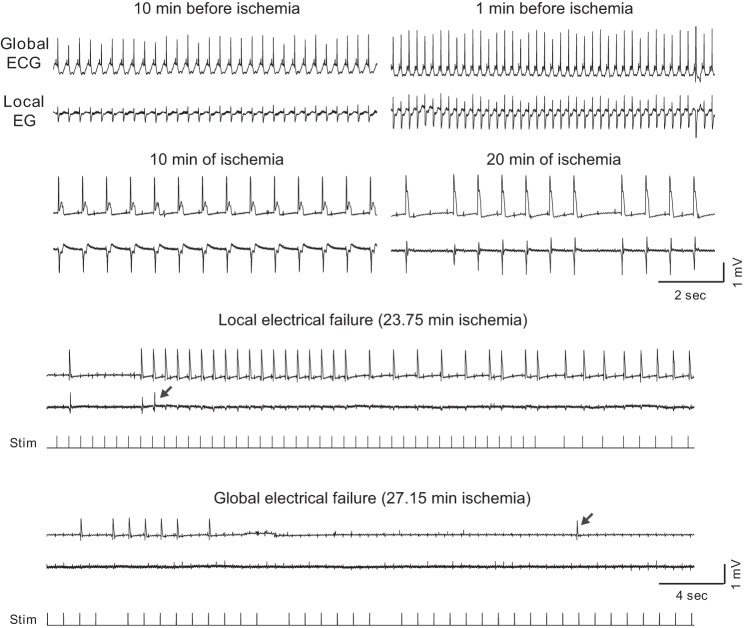
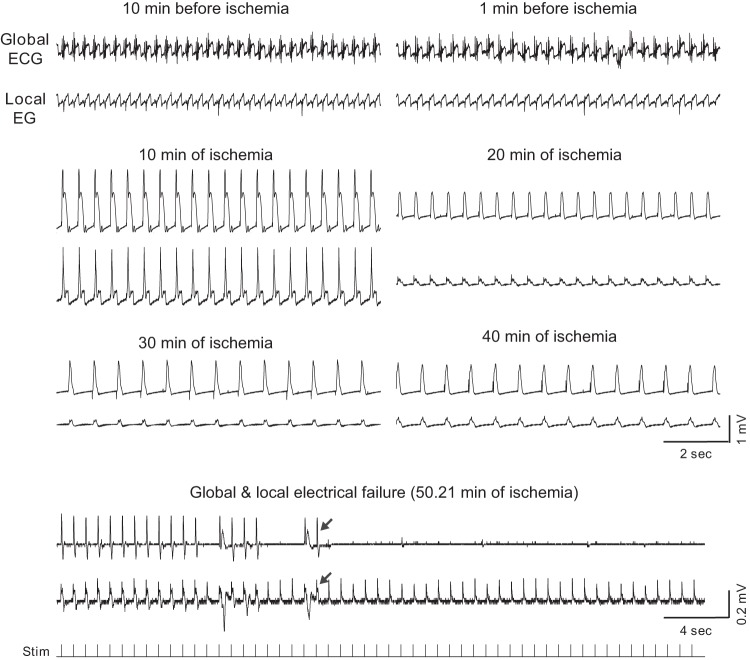
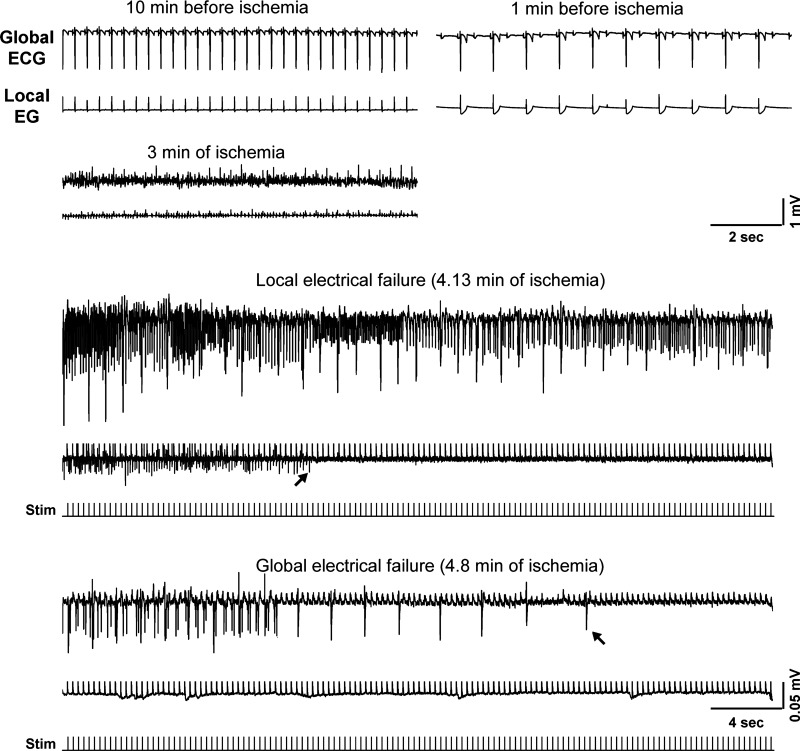
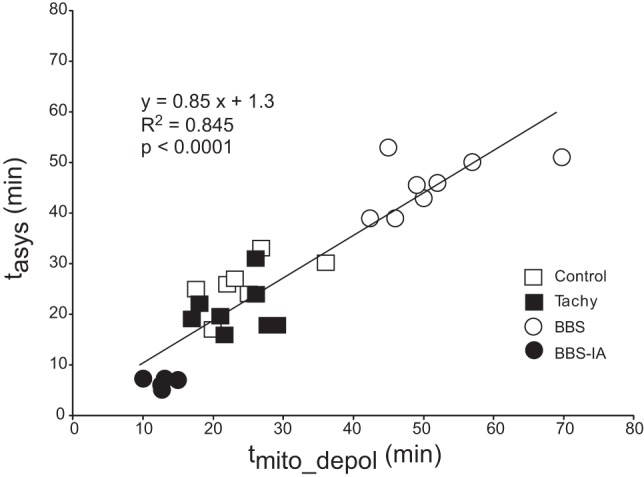
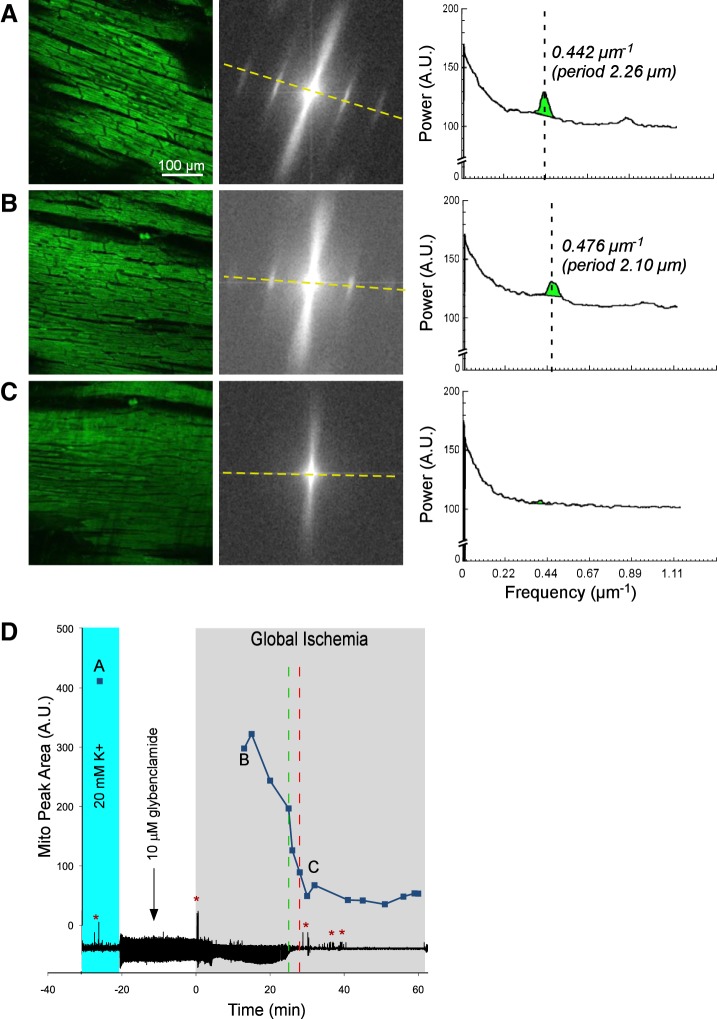
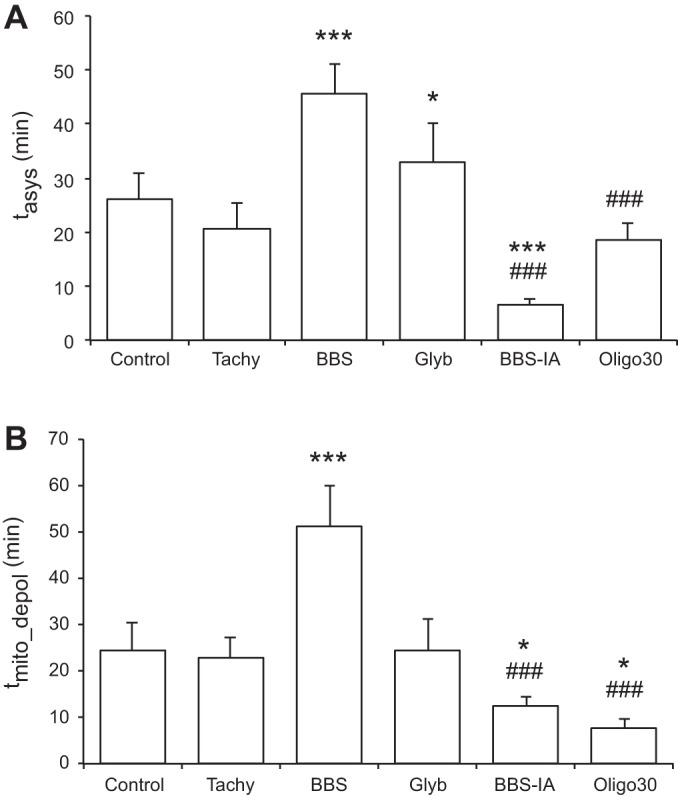
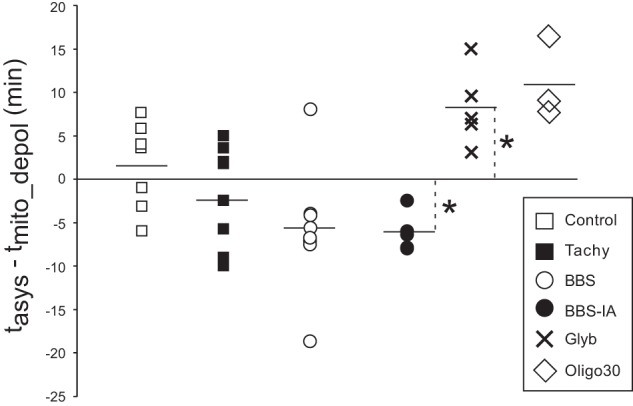
Mitochondrial membrane potential (ΔΨm) depolarization has been implicated in the loss of excitability (asystole) during global ischemia, which is relevant for the success of defibrillation and resuscitation after cardiac arrest. However, the relationship between ΔΨm depolarization and asystole during no-flow ischemia remains unknown. We applied spatial Fourier analysis to confocally recorded fluorescence emitted by ΔΨm-sensitive dye tetramethylrhodamine methyl ester. The time of ischemic ΔΨm depolarization (tmito_depol) was defined as the time of 50% decrease in the magnitude of spectral peaks reflecting ΔΨm. The time of asystole (tasys) was determined as the time when spontaneous and induced ventricular activity ceased to exist. Interventions included tachypacing (150 ms), myosin II ATPase inhibitor blebbistatin (heart immobilizer), and the combination of blebbistatin and the inhibitor of glycolysis iodoacetate. In the absence of blebbistatin, confocal images were obtained during brief perfusion with hyperkalemic solution and after the contraction failed between 7 and 15 min of ischemia. In control, tmito_depol and tasys were 24.4 ± 6.0 and 26.0 ± 5.0 min, respectively. Tachypacing did not significantly affect either parameter. Blebbistatin dramatically delayed tmito_depol and tasys (51.4 ± 8.6 and 45.7 ± 5.3 min, respectively; both P < 0.0001 vs. control). Iodoacetate combined with blebbistatin accelerated both events (tmito_depol, 12.7 ± 1.8 min; and tasys, 6.5 ± 1.1 min; both P < 0.03 vs. control). In all groups pooled together, tasys was strongly correlated with tmito_depol (R(2) = 0.845; P < 0.0001). These data may indicate a causal relationship between ΔΨm depolarization and asystole or a similar dependence of the two events on energy depletion during ischemia. Our results urge caution against the use of blebbistatin in studies addressing pathophysiology of myocardial ischemia.

Keywords: ATP-sensitive potassium channel; asystole; blebbistatin; mitochondrial depolarization; myocardial ischemia.


Figures

Fig. 1.
Fig. 1.
The relationship between mitochondrial membrane potential (ΔΨm) loss and asystole during global ischemia in a control heart. A–C, left to right: confocal images of TMRM fluorescence, the respective fast Fourier transform (FFT) power spectra, and the spectral profiles obtained along the direction of the longitudinal axis of myocytes (yellow dashed line). These data are obtained at the respective time points indicated in D. Light green in the spectral profiles denotes the mitochondrial peak area (MPA) that reflects the magnitude of ΔΨm. Vertical dashed lines indicate the position of mitochondrial peaks at the spatial frequency axis. Note the virtual absence of a mitochondrial peak in C, which corresponds to the loss of granular pattern in the tetramethylrhodamine perchlorate methyl ester (TMRM) image and heralds a significant, if not complete, loss of ΔΨm. D: time course of MPA time-aligned with the volume-conductor ECG (bottom). Gray area indicates the period of ischemia. Cyan color indicates the period of perfusion with a high (20 mM) concentration of potassium. Discontinuities in the MPA curve indicate changes in the field of view caused by the macroscopic shifts in the heart shape (shrinking/swelling) occurring during ischemia. Red arrow indicates the moment of ischemia-induced atrioventricular block, at which time ventricular pacing was initiated. Green dashed line indicates the time of 50% decrease in MPA (tmito_depol). Red dashed line, the time of asystole (tasys). Note that in this case asystole occurred ∼4 min after the apparent ΔΨm loss. Red asterisks indicate artifacts on the ECG caused by the movement of the microscope stage and manipulations on the perfusion tubing.
Fig. 2.
Fig. 2.
The relationship between ΔΨm loss and asystole during global ischemia in a heart from the group paced during ischemia at cycle length = 150 ms (Tachy group). A–C, left to right: layout is the same as in Fig. 1, A–C; confocal images of TMRM fluorescence, the respective FFT power spectra, and the spectral profiles obtained at the respective time points indicated in D. Note the virtual absence of a mitochondrial peak in C, which corresponds to the loss of granular pattern in the TMRM image and heralds a significant, if not complete, loss of ΔΨm. D: time course of MPA time-aligned with the volume-conductor ECG. The dashed line connecting points A and B indicates the fact that there were no confocal recordings between these two time points, but the imaged area in B could be recognized as the same or almost the same as the imaged area in A. Rapid pacing (cycle length = 150 ms) was initiated ∼1 min before the onset of ischemia. Green dashed line indicates tmito_depol. Red dashed line indicates tasys. Note that in this case asystole occurred ∼5 min before the apparent ΔΨm loss. Red asterisks indicates artifacts on the ECG caused by the movement of the microscope stage and manipulations on the perfusion tubing.
Fig. 3.
Fig. 3.
The relationship between ΔΨm loss and asystole during global ischemia in a heart from the group treated with 5.7 μM blebbistatin (BBS group). A–C, left to right: layout is the same as in Fig. 1, A–C; confocal images of TMRM fluorescence, the respective FFT power spectra, and the spectral profiles obtained at the respective time points indicated in D. Note the very low amplitude of the mitochondrial peak in C, which corresponds to the loss of granular pattern in the TMRM image and heralds a significant, if not complete, loss of ΔΨm. D: time course of MPA time aligned with the volume-conductor ECG. Note that unlike in Figs. 1 and 2, the preischemic perfusion with high potassium was not necessary because blebbistatin afforded complete immobilization. The fluctuations in the MPA values before and during the first 40 min of ischemia most likely reflect a high sensitivity of the MPA to slight changes in the focal plane. Red arrow indicates the moment of ischemia-induced atrioventricular block, at which time ventricular pacing was initiated. Green dashed line indicates tmito_depol. Red dashed line indicates tasys. Note a slow MPA decline compared with the control and Tachy groups (see Figs. 1 and 2). Asystole occurred ∼8 min before the apparent 50% ΔΨm loss, but after the (relatively slow) process of apparent ΔΨm loss had begun.
Fig. 4.
Fig. 4.
The relationship between ΔΨm loss and asystole during global ischemia in a heart from the group treated with 5.7 μM blebbistatin and 1 mM Na iodoacetate (BBS-IA). A–C, left to right: layout is the same as in Fig. 1, A–C; confocal images of TMRM fluorescence, the respective FFT power spectra, and the spectral profiles obtained at the respective time points indicated in D. Note the very low amplitude of the mitochondrial peak in C, which corresponds to the loss of granular pattern in the TMRM image and heralds a significant, if not complete, loss of ΔΨm. D: time course of MPA time aligned with the volume-conductor ECG. Note that unlike in Figs. 1 and 2, the preischemic perfusion with high potassium was not necessary because blebbistatin afforded complete immobilization. Black vertical arrow indicates the time when the perfusion was switched to the solution containing Na iodoacetate. Green dashed line indicates tmito_depol. Red dashed line indicates tasys. Note that the phase of fast MPA decline occurred very early (the point of 50% MPA loss was at 11.5 min of ischemia) compared with Figs. 1–3 but was followed by a partial recovery. Asystole occurred even earlier (at 6 min of ischemia) and never recovered. Red asterisks indicates artifacts on the ECG caused by the movement of the microscope stage and manipulations on the perfusion tubing.
Fig. 5.
Fig. 5.
Expanded segments of global and local ECG recordings at selected time points (as indicated) from a representative control experiment. All recordings during ischemia show paced rhythm. Arrows show the last identified ventricular excitation in the local and the global ECG, respectively. Note that local electrical failure occurred ∼3 min before the global electrical failure (asystole). The dual ECG strips showing the moments of local and global electrical failure are supplemented with the tracings of stimuli (note a different time scale). Note also that P waves asynchronous with pacing and ventricular activity are present in all ischemic recordings and persist even after full loss of ventricular capture. Stim, stimulus.
Fig. 6.
Fig. 6.
Expanded segments of global and local ECG recordings at selected time points (as indicated) from a representative BBS experiment (heart treated with 5.7 μM blebbistatin). All recordings during ischemia show paced rhythm. Arrows show the last identified excitation in the local and the global ECG, respectively. In this experiment local and global electrical failure occurred simultaneously. Note a different time and voltage scale in the lowermost dual ECG strip. The recording at the very bottom shows the timing of stimulation. Note that the spikes seen in the local EG recording after the last detected excitation are due to stimulus artifacts.
Fig. 7.
Fig. 7.
Expanded segments of global and local ECG recordings at selected time points (as indicated) from a representative BBS-IA experiment (heart treated with 5.7 μM blebbistatin and 1 mM iodoacetate). Arrows show the last identified excitation in the local and the global ECG, respectively. The dual ECG strips showing the moments of local and global electrical failure are supplemented with the tracings of stimuli. Note a different time and voltage scale in these two ECG strips. Noteworthy features: 1) partial atrioventricular blockade occurred already before the onset of ischemia; 2) a fine ventricular fibrillation is seen at 3 min of ischemia; and 3) before the full electrical failure, the amplitude of both global and local ECG is only about 5–10% of the preischemic amplitude.
Fig. 8.
Fig. 8.
Direct correlation between tmito_depol and tasys in 4 groups (control, Tachy, BBS, and BB-IA) pooled together. Note that on average tasys was slightly ahead of tmito_depol, judging from the fact that the slope of the linear regression curve was <1.
Fig. 9.
Fig. 9.
Relationship between ΔΨm loss and asystole during global ischemia in a heart from the group treated with 10 μM glybenclamide (Glyb group). A–C, left to right: confocal images of TMRM fluorescence, the respective FFT power spectra, and the spectral profiles obtained at the respective time points indicated in D. Note the virtual absence of the mitochondrial peak in C, which corresponds to the loss of granular pattern in the TMRM image and heralds a significant, if not complete, loss of ΔΨm. D: time course of MPA time aligned with the volume-conductor ECG. Gray area indicates the period of ischemia. Cyan color indicates the period of perfusion with a high (20 mM) concentration of potassium. Discontinuity in the MPA curve between points A and B indicates a change in the field of view caused by macroscopic shifts in the heart shape (shrinking/swelling), which occurred during early ischemia. Green dashed line indicates tmito_depol. Red dashed line indicates tasys. Asystole occurred after the apparent 50% ΔΨm loss, which was the case in all Glyb experiments (see Fig. 11). Note that the earliest ischemic value of MPA (point B) was much lower than the preischemic value (point A). This was a consistent finding in the Glyb group, contrasting it from other groups for reasons not completely understood (see text for more detail). Red asterisks indicate artifacts on the ECG caused by the movement of the microscope stage and manipulations on the perfusion tubing.
Fig. 10.
Fig. 10.
Comparison of tasys (A) and tmito_depol (B) between all experimental groups. Oligo30 group, group treated with F0F1 ATPase blocker oligomycin at the concentration of 30 μM for 12–15 min before the onset of ischemia. *P < 0.05 vs. control; ***P < 0.0001 vs. control; ###P < 0.0001 vs. BBS.
Fig. 11.
Fig. 11.
The difference between tasys and tmito_depol (tasystmito_depol) in all experiments from all the groups. Positive values mean that tasys follows tmito_depol and vice versa. The horizontal line in each group indicates the average value. Note that in the BBS-IA group, tasys always precedes tmito_depol, and in the Glyb and Oligo30 groups, tasys always follows tmito_depol. *P < 0.05 vs. 0.

Similar articles

Cited by

References

    1. Abi-Gerges N, Pointon A, Pullen GF, Morton MJ, Oldman KL, Armstrong D, Valentin JP, Pollard CE. Preservation of cardiomyocytes from the adult heart. J Mol Cell Cardiol 64: 108–119, 2013. - PubMed
    1. Akar FG, Aon MA, Tomaselli GF, O'Rourke B. The mitochondrial origin of postischemic arrhythmias. J Clin Invest 115: 3527–3535, 2005. - PMC - PubMed
    1. Baker LC, Wolk R, Choi BR, Watkins S, Plan P, Shah A, Salama G. Effects of mechanical uncouplers, diacetyl monoxime, and cytochalasin-D on the electrophysiology of perfused mouse hearts. Am J Physiol Heart Circ Physiol 287: H1771–H1779, 2004. - PubMed
    1. Brack KE, Narang R, Winter J, Ng GA. The mechanical uncoupler blebbistatin is associated with significant electrophysiological effects in the isolated rabbit heart. Exp Physiol 98: 1009–1027, 2013. - PMC - PubMed
    1. Choi BR, Salama G. Simultaneous maps of optical action potentials and calcium transients in guinea-pig hearts: mechanisms underlying concordant alternans. J Physiol 529: 171–188, 2000. - PMC - PubMed

Publication types

MeSH terms

Substances

LinkOut - more resources