. 2015 Jan;43(2):943-59.
doi: 10.1093/nar/gku1356. Epub 2014 Dec 30.

DNA polymerase β deficiency leads to neurodegeneration and exacerbates Alzheimer disease phenotypes

Affiliations

DNA polymerase β deficiency leads to neurodegeneration and exacerbates Alzheimer disease phenotypes

Peter Sykora et al. Nucleic Acids Res. 2015 Jan.

Abstract

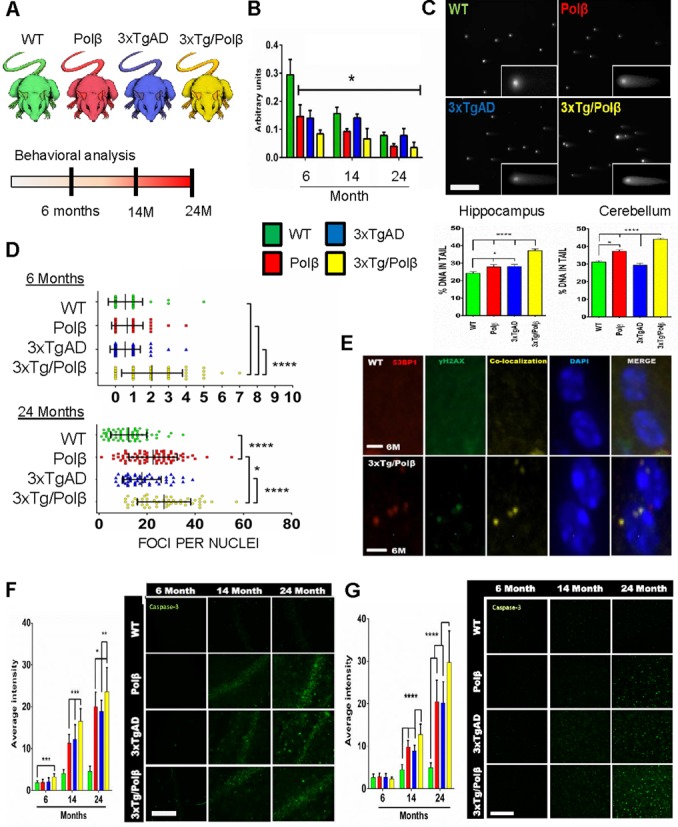
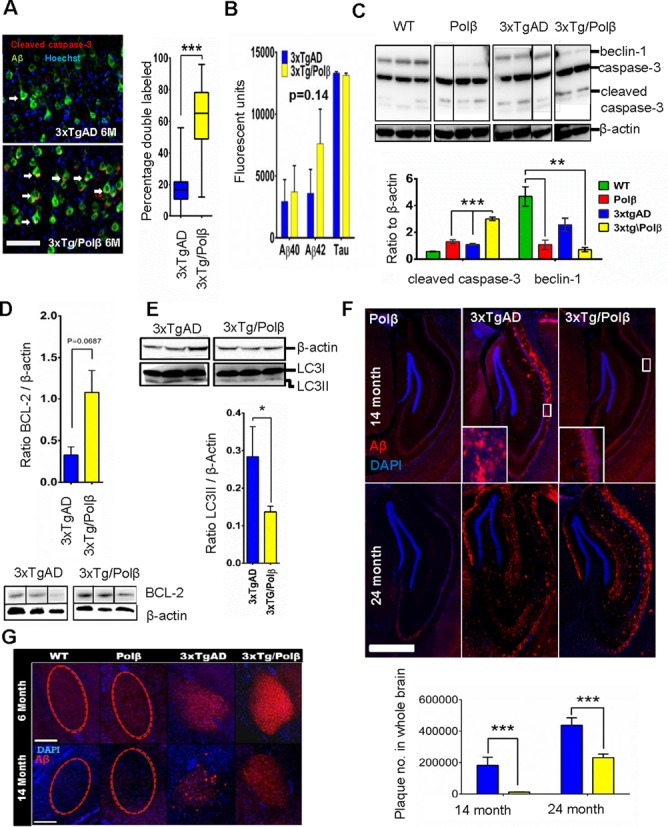
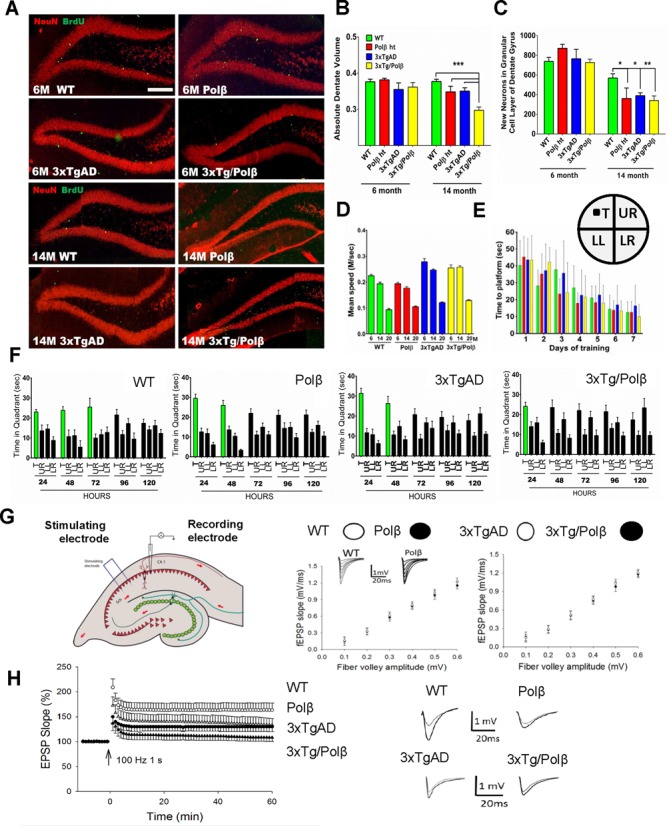
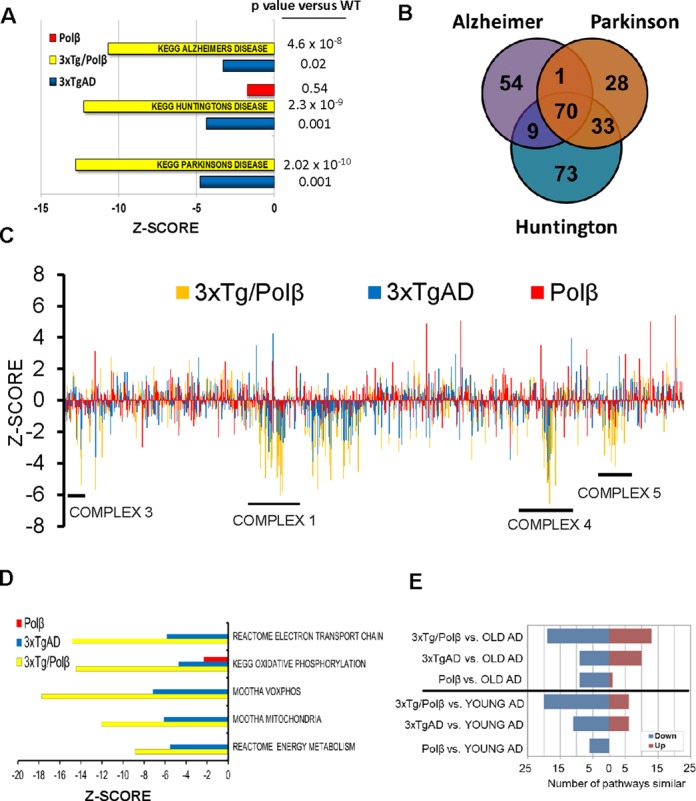
We explore the role of DNA damage processing in the progression of cognitive decline by creating a new mouse model. The new model is a cross of a common Alzheimer's disease (AD) mouse (3xTgAD), with a mouse that is heterozygous for the critical DNA base excision repair enzyme, DNA polymerase β. A reduction of this enzyme causes neurodegeneration and aggravates the AD features of the 3xTgAD mouse, inducing neuronal dysfunction, cell death and impairing memory and synaptic plasticity. Transcriptional profiling revealed remarkable similarities in gene expression alterations in brain tissue of human AD patients and 3xTg/Polβ(+/-) mice including abnormalities suggestive of impaired cellular bioenergetics. Our findings demonstrate that a modest decrement in base excision repair capacity can render the brain more vulnerable to AD-related molecular and cellular alterations.


Figures

Figure 1.
Figure 1.
DNA polymerase β decline causes increased susceptibility to DNA damage in the mouse brain. (A) Diagrammatic representation of study. Mice utilized; Wild type (WT), Polymerase β heterozygous (Polβ), Alzheimer's (AD) transgenic (3xTgAD) and the 3xTgAD/Polβ cross (3xTg/Polβ). Comprehensive behavioral analysis was conducted at 6, 14 and 24 months. (B) Cortex Polβ protein levels in the four mouse lines at the indicated ages. All groups had significantly lower protein levels compared to 6-month WT mice, n = 3, *P < 0.05. Refer to Supplementary Figure S1A for additional information and full images. (C) Neutral comet analysis of designated mouse brain regions shows more DNA strand breaks in 3xTg/Polβ mice at 24 months of age. ****P < 0.001, scale bar = 300 μm. (D) Quantitation of double-stranded break (DSB) foci per cell by γH2AX staining shows increases in only the 3xTg/Polβ mice at 6 months, while all transgenic groups have elevated foci levels at 24 months compared to WT (n = 3 for each set, greater than 50 cells counted per set). Error bars represent mean ± SD. (E) Co-localization between antibodies targeting 53BP1 and γH2AX confirms that these foci mark DNA DSBs. Six month (M) old WT and 3xTgAD/Polβ mice are shown as a representative image. Scale bar = 5 μm. (F) Levels of cleaved caspase-3 in the hippocampus correspond to age, disease and repair deficiency. **P < 0.01, ***P < 0.005, n = 3, multiple sequential sections per animal. Scale bar = 200 μm. (G) Levels of cleaved caspase-3 in the cortex confirm global increase in apoptotic activation in transgenic mice after 14 months, n = 3, multiple sections per animal, scale bar = 200 μm. Error bars represent mean ± standard error of mean (SEM), in all panels and figures unless otherwise specified.
Figure 2.
Figure 2.
DNA Repair deficiency modulates Aβ deposition. (A) Cleaved caspase-3 immunoreactivity co-localized with amyloid signal in 6-month cortex samples at a higher frequency in repair deficient mice. n = 4 per set, 50 cells per mouse, scale bar = 50 μm. (Right) Y-axis represents the percentage of Aβ positive cells that also had distinct cleaved caspase-3 co-localization. Box plot shows mean ± SD. Arrows indicate cells with dual antibody co-localization. *** P< 0.005 (B) Levels of AD hallmark peptides Aβ40, Aβ42 and tau were not significantly altered with repair deficiency (also see Supplementary Figure S2A and B) in 14-month hippocampal extracts (n = 4). Arbitrary units are a measure of ELISA fluorescent output. (C) Autophagy protein beclin-1 is heavily reduced in 14-month repair deficient mice. Levels of the full length and cleaved caspase-3 are also altered in all transgenic groups. Graph of cleaved caspase shows that 3xTg/Polβ animals have higher levels of the apoptotic marker than parental lines compared to β-actin housekeeping protein (n = 4). ** P< 0.01 (D) The 14-month 3xTg/Polβ mice had higher ratio of anti-autophagic protein BCL-2 (n = 3). (E) There was lowerLC3II/ β-Actin ratio in the 14-month 3xTg/Polβ animals (n = 4), western insert shows LC3II levels higher in 3xtgAD animals (LC3I overexposed, refer to Supplementary Figure S2C for additional images). All bands shown were run on the same gel but are not contiguous. (F) The 3xTg/Polβ animals have slowed extracellular Aβ deposition in the hippocampal region with no extracellular plaques present at 14 months. Instead the mice display visible intracellular Aβ deposition, scale bar = 1.5 mm, image is representative of n = 4. (Insert) Extracellular Aβ plaques in 14-month 3xTgAD mice and intracellular deposition of Aβ in 3xTg/Polβ mice. WT (not shown) and Polβ animals did not have Aβ deposition. At 24 months both 3xTgAD and 3xTg/Polβ had extensive plaques formation not observed in the non-3xTg groups. (Bottom) Quantitation of extracellular plaque number through the brain in 14- and 24-month animals, n = 3, full description in materials and methods. (G) As observed in the hippocampus, amyloid deposition in the amygdala shifts from intracellular to predominantly extracellular in the 3xTgAD mice at 14 months but not in the 3xTg/Polβ group, scale bar = 200 μm, images are representative, n = 4.
Figure 3.
Figure 3.
DNA repair deficiency drives AD-related hippocampal degeneration. (A) The dentate gyrus shows no difference in volume or BrdU incorporation (neurogenesis) at 6 months, but after 14 months a significant decrease in neurogenesis and dentate volume is observed in all groups compared to WT. Scale bar = 400 μm (n = 4). (B) Dentate gyrus volume measured as a proportion of total brain volume shows a synergistic decrease in the 3xTg/Polβ group at 14 months compared to all groups (n = 4). (C) The level of neurogenesis in the dentate gyrus is not significantly affected at 6 months though BrdU incorporation is heavily reduced in all groups after 14 month compared to WT (n = 4).* P< 0.05, ** P< 0.01, *** P< 0.005 (D) We used the Morris water maze (MWM) to measure hippocampal dependent memory loss. Water maze swim speed was higher in 3xTg groups at 6 and 14 months but was comparative at 20 months (n = 8–14). (E) There was no difference in learning in any of the groups in the MWM (see also Supplementary Figure S3B) (insert) diagrammatic representation of water maze showing platform location. Quadrant abbreviations: T = target quadrant, UR = upper right quadrant, LL = lower left, LR = lower right. (F) Memory retention was affected at 20 months in all groups compared to WT, notably the most affected was the 3xTg/Polβ group. Green bars represent days of significant memory retention. Significance was determined using quadrant comparison with Bonferroni post hoc analysis. (G) Long-term potentiation (LTP) measured at the Schaffer collateral synapses (n = 8, 4 pairs). There was no difference in pre-synaptic transmissions. (H) Post synaptic defect was detected with significant differences between all groups compared to WT. The 3xTg/Polβ mice had a synergistic decrease in LTP, relative to 3xTg and Polβ.
Figure 4.
Figure 4.
The 3xTg/Polβ mouse has severe energetic dysfunction and has more pathways similar to human AD patients than the 3xTgAD or Polβ mice alone. (A) KEGG pathway analysis showed that 3xTg/Polβ array had a more significantly changed pathway z-scores and P values when compared to three common neurodegenerative diseases than parental lines. (B) Venn diagram of genes most commonly deregulated in the three KEGG disease pathways shows that 70 genes are in common, 68 of these are involved in mitochondrial bioenergetics, 2 in apoptotic response. (C) Gene expression changes of 1500 mitochondrial-related genes (each strain relative to WT). Results show genes associated with energy complex formation are particularly affected in 3xTgAD and synergistically downregulated in 3xTg/Polβ. Genes particularly affected in the 3xTg/Polβ animals correspond to complexes (as numbered on diagram) 1, 3, 4 and 5. (D) Microarray data confirm that many pathways associated with energy metabolism are significantly deregulated in the 3xTg/Polβ mouse; also see S4D for P value analysis. (E) We compared the mouse gene expression results to a large human AD prefrontal cortex microarray data set (Zhang et al. (87)) (GSE44770). OLD AD refers to late onset AD patients, YOUNG AD refers to patients with mild cognitive impairment, an AD precursor disease.

Similar articles

Cited by

References

    1. Cummings J.L., Morstorf T., Zhong K. Alzheimer's disease drug-development pipeline: few candidates, frequent failures. Alzheimers Res. Ther. 2014;6:37–44. - PMC - PubMed
    1. Bradley-Whitman M.A., Timmons M.D., Beckett T.L., Murphy M.P., Lynn B.C., Lovell M.A. Nucleic acid oxidation: an early feature of Alzheimer's disease. J. Neurochem. 2014;128:294–304. - PMC - PubMed
    1. Bradley M.A., Xiong-Fister S., Markesbery W.R., Lovell M.A. Elevated 4-hydroxyhexenal in Alzheimer's disease (AD) progression. Neurobiol. Aging. 2012;33:1034–1044. - PMC - PubMed
    1. Bradley M.A., Markesbery W.R., Lovell M.A. Increased levels of 4-hydroxynonenal and acrolein in the brain in preclinical Alzheimer disease. Free Radic. Biol. Med. 2010;48:1570–1576. - PMC - PubMed
    1. Gabbita S.P., Lovell M.A., Markesbery W.R. Increased nuclear DNA oxidation in the brain in Alzheimer's disease. J. Neurochem. 1998;71:2034–2040. - PubMed

Publication types