. 2015 Jan 27;112(4):957-64.
doi: 10.1073/pnas.1416544112. Epub 2014 Dec 31.

Giant ankyrin-G: a critical innovation in vertebrate evolution of fast and integrated neuronal signaling

Affiliations

Giant ankyrin-G: a critical innovation in vertebrate evolution of fast and integrated neuronal signaling

Paul M Jenkins et al. Proc Natl Acad Sci U S A. .

Abstract

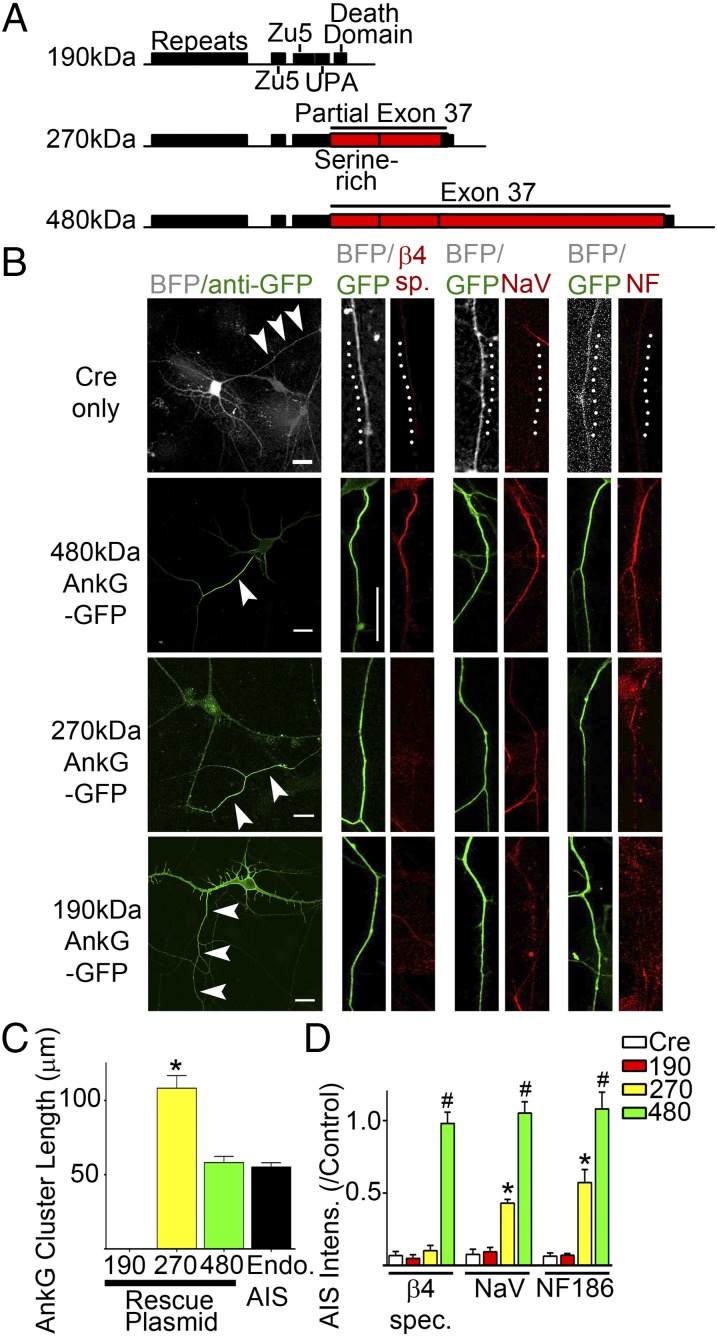
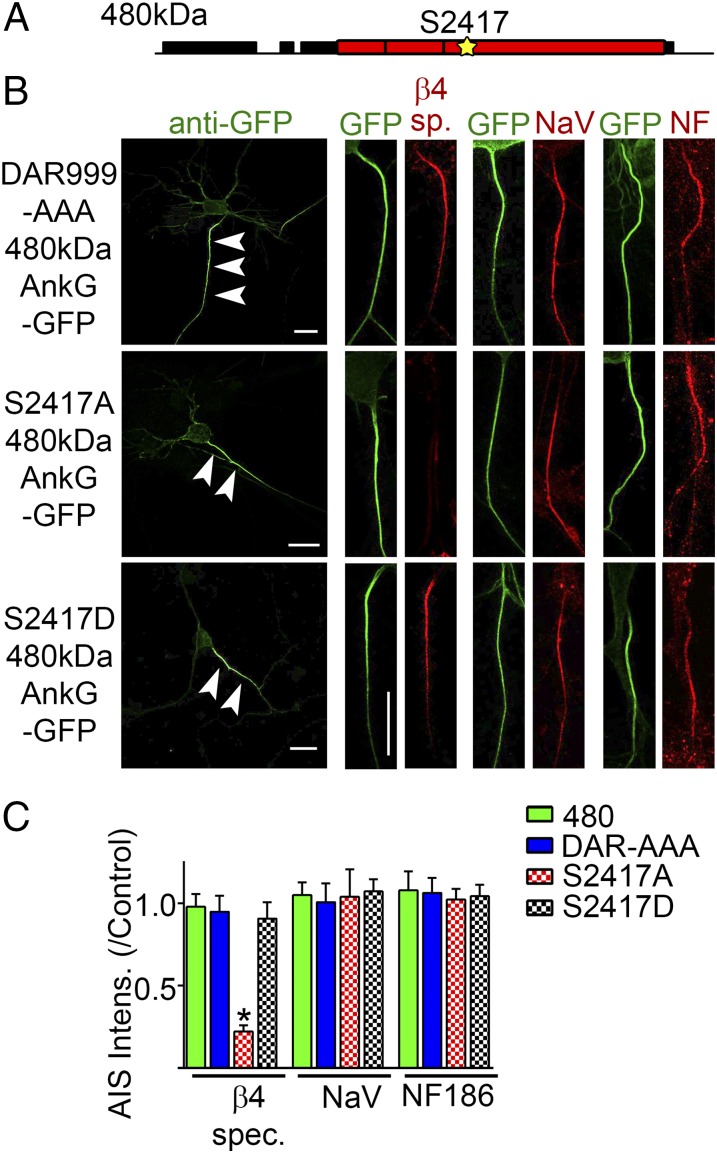
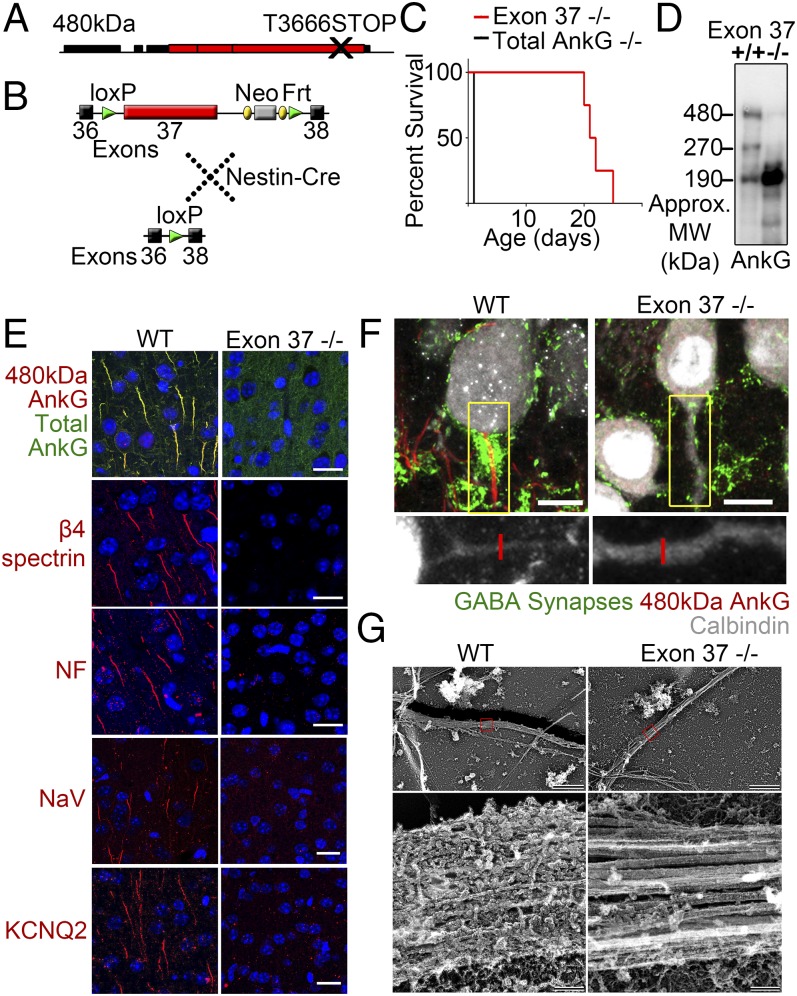
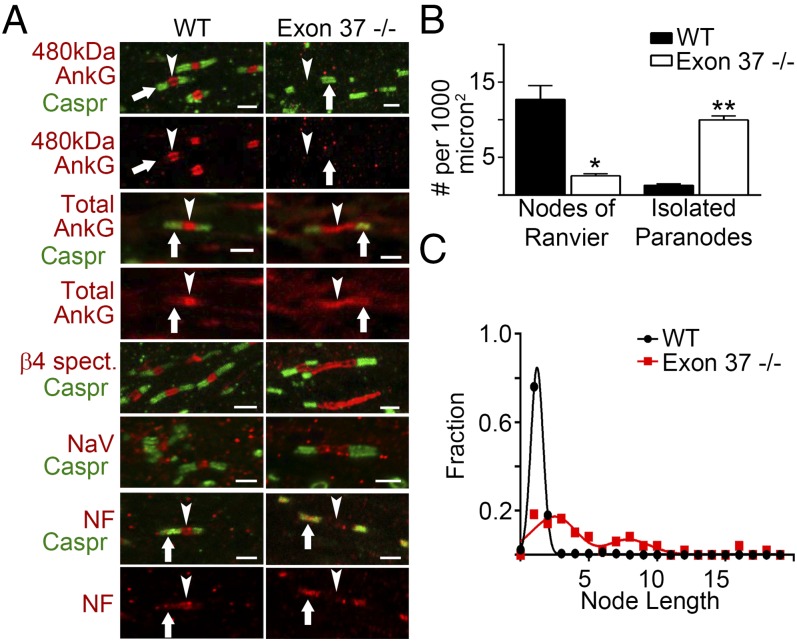
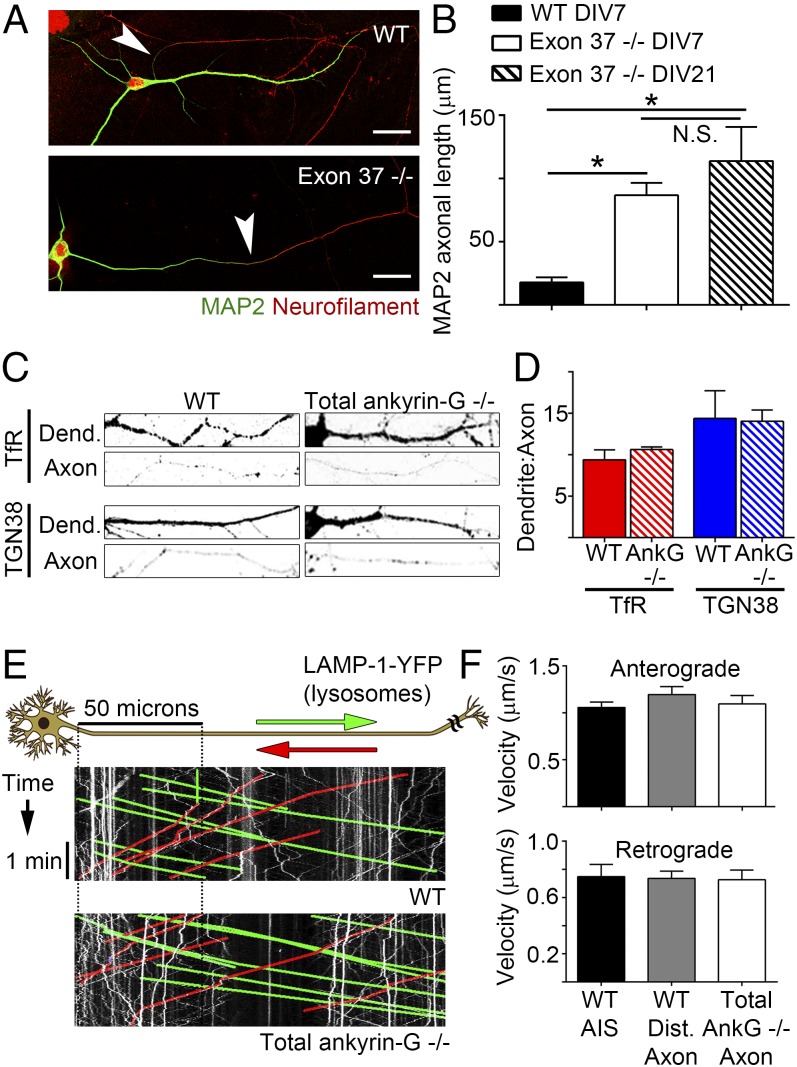
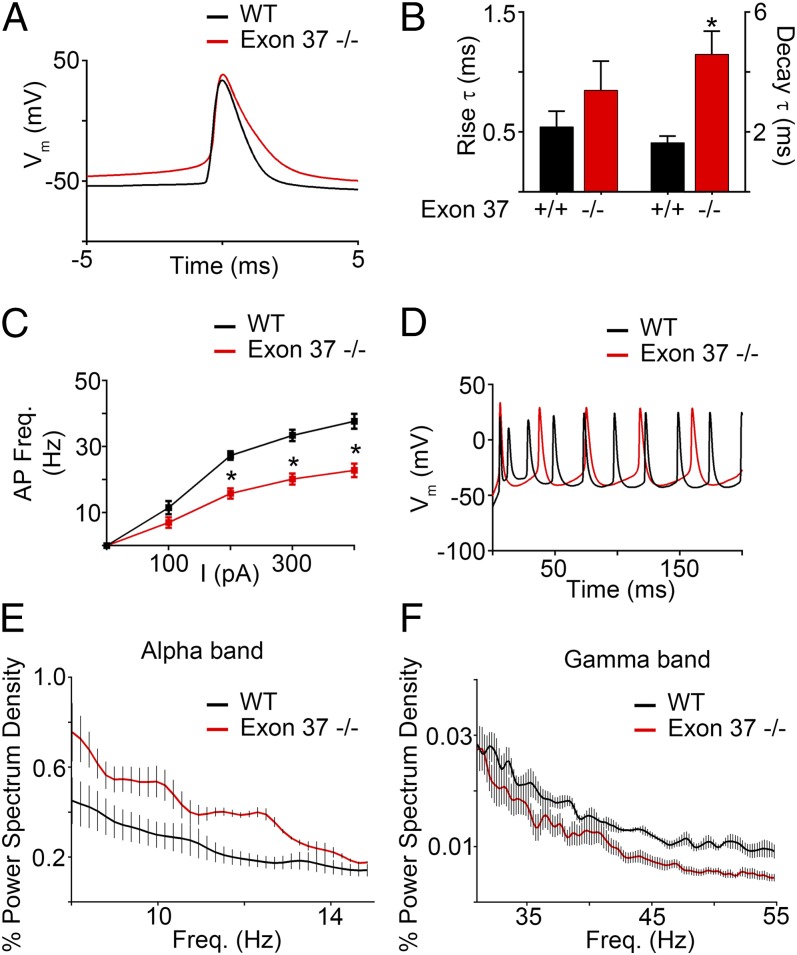
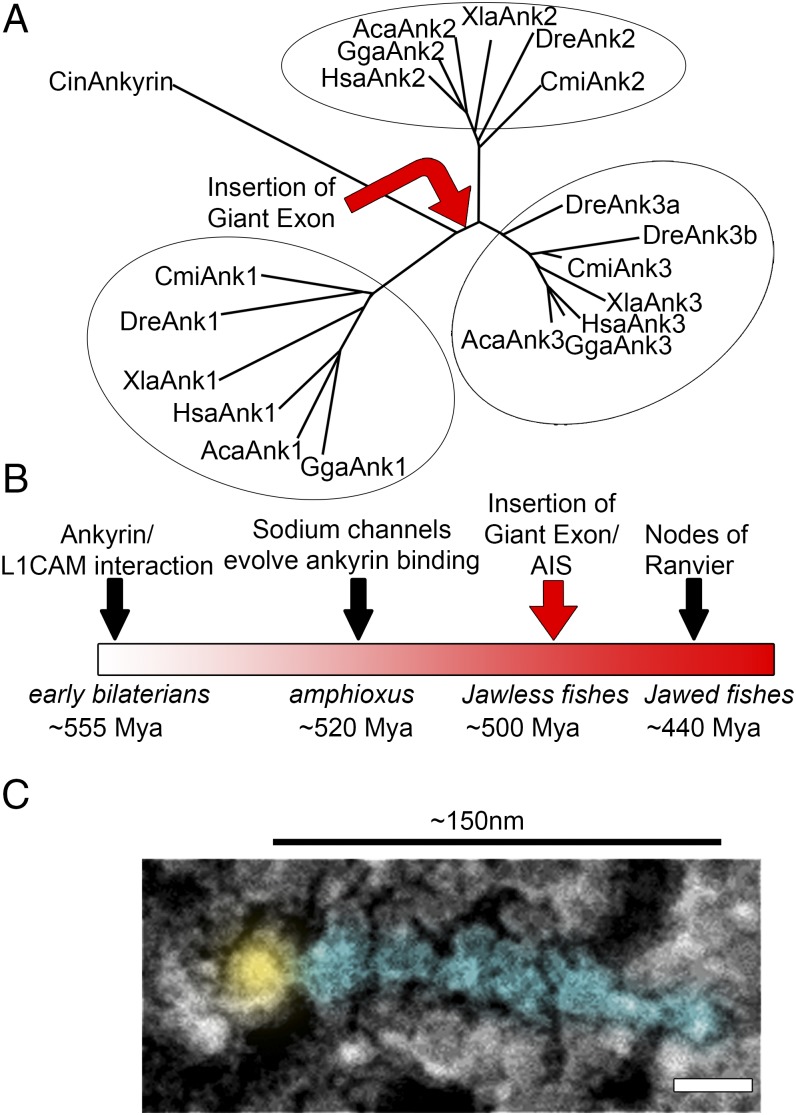
Axon initial segments (AISs) and nodes of Ranvier are sites of clustering of voltage-gated sodium channels (VGSCs) in nervous systems of jawed vertebrates that facilitate fast long-distance electrical signaling. We demonstrate that proximal axonal polarity as well as assembly of the AIS and normal morphogenesis of nodes of Ranvier all require a heretofore uncharacterized alternatively spliced giant exon of ankyrin-G (AnkG). This exon has sequence similarity to I-connectin/Titin and was acquired after the first round of whole-genome duplication by the ancestral ANK2/ANK3 gene in early vertebrates before development of myelin. The giant exon resulted in a new nervous system-specific 480-kDa polypeptide combining previously known features of ANK repeats and β-spectrin-binding activity with a fibrous domain nearly 150 nm in length. We elucidate previously undescribed functions for giant AnkG, including recruitment of β4 spectrin to the AIS that likely is regulated by phosphorylation, and demonstrate that 480-kDa AnkG is a major component of the AIS membrane "undercoat' imaged by platinum replica electron microscopy. Surprisingly, giant AnkG-knockout neurons completely lacking known AIS components still retain distal axonal polarity and generate action potentials (APs), although with abnormal frequency. Giant AnkG-deficient mice live to weaning and provide a rationale for survival of humans with severe cognitive dysfunction bearing a truncating mutation in the giant exon. The giant exon of AnkG is required for assembly of the AIS and nodes of Ranvier and was a transformative innovation in evolution of the vertebrate nervous system that now is a potential target in neurodevelopmental disorders.

Keywords: ankyrin-G; axon initial segment; axonal polarity; cognitive impairment disorder; neuropsychiatric disease.


Conflict of interest statement

The authors declare no conflict of interest.

Figures

Fig. 1.
Fig. 1.
The entire giant ankyrin-G insert is necessary for clustering of AISs. (A) Representation of the AnkG transcripts with giant inserted exon 37 marked in red. (B) Representative images of cultured total AnkG-null hippocampal neurons (Top) or those rescued with indicated GFP constructs. Arrowheads denote axon. Blue fluorescent protein (BFP) signal for Cre only neurons shown in white and anti-GFP shown in green. Clustering of AIS components β4 spectrin, VGSC (NaV), and NF186 (NF) shown on right in red. (Scale bars: 20 µm.) (C) Quantification of length of AnkG-GFP clustering from B compared with endogenous AIS (Endo. AIS). *P < 0.05 compared with 480-kDa AnkG rescue and endogenous axon initial segments (one-way ANOVA, P < 0.0001, Tukey post hoc test, n = 18–23 per group). (D) Quantification of mean fluorescence intensity of AIS of total AnkG-null hippocampal neurons rescued with indicated constructs relative to untransfected controls. *P < 0.05 relative to Cre alone and 190-kDa AnkG-GFP; #P < 0.05 relative to Cre alone, 190-kDa, and 270-kDa AnkG-GFP (one-way ANOVA, P < 0.0001, Tukey post hoc test, n = 5–7 for each group).
Fig. 2.
Fig. 2.
β4 spectrin is recruited to the AIS through a noncanonical interaction with ankyrin-G that is likely regulated by phosphorylation. (A) Representation of the 480-kDa AnkG transcript with the location of S2417 marked by a yellow star. (B) Representative images of cultured exon 22/23-null hippocampal neurons rescued with indicated constructs. Arrowheads denote axon. Anti-GFP shown in green. AIS partners shown on right in red. (Scale bars: 20 µm.) (C) Quantification of mean fluorescence intensity of AIS partners. *P < 0.05 relative to 480-kDa AnkG-GFP (one-way ANOVA, P < 0.0001 followed by Tukey post hoc test, n = 5–7 for each group). Note: Data from 480-kDa AnkG-GFP rescue from Fig. 1D.
Fig. 3.
Fig. 3.
Deletion of the giant insert of ankyrin-G causes a complete loss of known AIS components. (A) Representation of the 480-kDa AnkG transcript with location of the premature stop at T3666 (41) marked by black ×. (B) Strategy for genetic deletion of the giant AnkG exon. (C) Survival curve from giant AnkG-null (exon 37 −/−, red) or total AnkG-null (exon 22/23 −/−, black) mice. (D) Western blot of whole brain lysate from p20 WT (+/+) and exon 37-null (−/−) mice probed with total AnkG antibodies. (E) Representative images from coronal sections of p20 WT (Left) or exon 37−/− (Right) layer II/III cortex. AIS partners shown in red [480-kDa AnkG, NF186, NaV (VGSC), and KCNQ2]. (Top) Includes immunolabeling for total AnkG shown in green. Dapi shown in blue. (Scale bars: 20 µm.) (F) Representative images of cerebellar sections from WT (Left) or exon 37 −/− (Right) mice stained with antibodies to the GABAergic synapse marker VGAT (green), 480-kDa AnkG (red), and Purkinje cell marker calbindin (white). Higher magnification image of calbindin from region of interest shown Below. Red bar denotes width of exon 37 −/− proximal axon. (Scale bars: 10 µm.) (G) Platinum replica electron micrographs of the proximal axon of WT (Left) and exon 37-null (Right) cultured hippocampal neurons at 7 DIV showing complete loss of the fibrillogranular coat. Higher magnification images of red regions of interest shown on Bottom. (Scale bars: Top, 2 µm; Bottom, 100 nm.)
Fig. 4.
Fig. 4.
Loss of giant ankyrin-G causes a dramatic reduction in the number of nodes of Ranvier and malformation of remaining nodes. (A) Representative images of nodes of Ranvier from the corpus callosum of p20 WT (Left) and exon 37-null (Right) brains. Caspr shown in green. Nodal proteins are shown in red. (Scale bars: 2 µm.) Arrowheads denote node of Ranvier. Arrows denote paranode. (B) Number of nodes of Ranvier (Left) or isolated paranodes (Right) per 1,000 μm2 in corpus callosum from p20 WT (filled bars) or exon 37-null (open bars). *P = 0.0053 (WT, 12.7 ± 1.8, n = 3; exon 37-null, 2.5 ± 0.3, n = 3). **P < 0.0001 (WT, 1.3 ± 0.2, n = 3; exon 37-null, 10.0 ± 0.5, n = 3). Data shown are mean ± SEM. (C) Histogram node of Ranvier length from corpus callosum of p20 WT (black) and exon 37-null (red) brains (WT, n = 167, mean length 1.3 ± 0.1 µm; exon 37-null, n = 49, mean length 5.1± 0.6 µm).
Fig. 5.
Fig. 5.
Rate of axonal transport and steady-state localization of dendritic proteins is unaffected by loss of AIS. (A) Representative images of DIV8 cultured hippocampal neurons from WT (Top) or exon 37-null (Bottom) mice. The dendritic marker MAP2 is shown in green, and the axonal marker neurofilament is shown in red. Transition from dendritic character to axonal character marked by arrowhead. (Scale bars: 20 µm.) (B) Average distance of MAP2 invasion in DIV7 or DIV21 exon 37 −/− compared with control (one-way ANOVA, P < 0.04 followed by Tukey post hoc test, n = 4–13 for each group, *P < 0.05, N.S., not significant. (C) Representative images of steady-state localization of the dendritic cargos, transferrin receptor-YFP (TfR, Top) or TGN38-YFP (Bottom) to dendrites and distal axons from WT (Left) or total AnkG-null (Right) DIV7 hippocampal cultures. (D) Quantification of dendrite to axon fluorescence intensity ratio of TfR-YFP (red) or TGN38-YFP (blue) in WT (solid) or total AnkG-null (hatched) DIV7 hippocampal neurons (TfR, P = 0.35; WT, 9.4 ± 1.2, n = 5; total AnkG-null, 10.6 ± 0.33, n = 5; TGN38, P = 0.9145; WT, 14.4 ± 3.3, n = 4; total AnkG-null, 14.0 ± 1.4, n = 6). (E) Kymograph analysis of lysosomal (LAMP-1-YFP) movement through and past the AIS from WT (Top) or total AnkG-null (exon 22/23 −/−, Bottom) cultured hippocampal neurons. (Scale bars: 1 min for y axis and 50 µm for x axis.) Dotted lines represent length of average AIS (∼50 µm) on kymograph. (F) Quantification of velocity of LAMP1-YFP in the anterograde (Top) or retrograde (Bottom) direction for the WT AIS (black, first 50 µm), WT distal axon (gray, 50–150 µm), or total AnkG-null proximal axon (white, first 50 µm).
Fig. 6.
Fig. 6.
APs persist in the exon 37-null mouse, although with altered dynamics and differences in integrated signaling. (A) Representative aligned single AP traces from WT (black) or exon 37-null (red) cortical neurons at +400 pA current injection. (B) Time constants (τ) for AP rise (Left) or decay (Right) from WT (black) or exon 37-null (red) at +400 pA current injection (rise τ, WT, 0.5 ± 0.1, n = 10; exon 37-null, 0.8 ± 0.2, n = 10; decay τ, *P < 0.05, WT, 1.6 ± 0.2, n = 10; exon 37-null, 4.6 ± 0.8, n = 10). (C) Elicited AP frequency from cortical neurons from WT (black) or exon 37-null (red) acute brain slices. Data shown are mean ± SEM, *P < 0.05 compared with WT. (D) Representative AP traces from cortical neurons from WT (black) or exon 37-null (red) at +400 pA current injection. (E) Relative alpha band (8–15 hz) local field potential power spectrum of awake p20 WT (black) or exon 37-null (red) mice plotted as a percentage of total EEG power spectrum. Data shown are mean ± SEM from three mice (five sessions total for each genotype). (F) Relative gamma band (32–55 hz) local field potential power spectrum of awake p20 WT (black) or exon 37-null (red) mice plotted as a percentage of EEG power spectrum. Data shown are mean ± SEM from three mice (five session total for each genotype).
Fig. 7.
Fig. 7.
Insertion of a single conserved exon in vertebrates coincided with formation of the AIS and nodes of Ranvier. (A) Rooted phylogenetic tree depicting evolutionary relationships between members of the ankyrin gene family. Arrow represents timing of the insertion of the giant exon 37. Cin, Ciona intestinalis; Cmi, Callorhinchus milii; Dre, Danio rerio; Xla, Xenopus laevis; Aca, Anolis carolinensis; Gga, Gallus gallus; Hsa, Homo sapiens. Circled areas denote individual Ank gene groups. (B) Relative time of critical steps in the evolution of the nervous system. Insertion of giant exon marked with red arrow. Example organisms shown underneath in italics along with the approximate time of evolution (million years ago). (C) Immunogold labeling of AnkG from a platinum replica electron micrograph of an AIS of a cultured rat hippocampal neuron. Gold particle marked in yellow. AnkG molecule marked in cyan. (Scale bar: 25 nm.)

References

    1. Zalc B, Goujet D, Colman D. The origin of the myelination program in vertebrates. Curr Biol. 2008;18(12):R511–R512. - PubMed
    1. Somogyi P. A specific ‘axo-axonal’ interneuron in the visual cortex of the rat. Brain Res. 1977;136(2):345–350. - PubMed
    1. Grubb MS, Burrone J. Activity-dependent relocation of the axon initial segment fine-tunes neuronal excitability. Nature. 2010;465(7301):1070–1074. - PMC - PubMed
    1. Kuba H, Oichi Y, Ohmori H. Presynaptic activity regulates Na(+) channel distribution at the axon initial segment. Nature. 2010;465(7301):1075–1078. - PubMed
    1. Rasband MN. The axon initial segment and the maintenance of neuronal polarity. Nat Rev Neurosci. 2010;11(8):552–562. - PubMed

Publication types

LinkOut - more resources