. 2015 Apr 1;113(7):2321-41.
doi: 10.1152/jn.01040.2014. Epub 2014 Dec 30.

Spatiotemporal dynamics of optogenetically induced and spontaneous seizure transitions in primary generalized epilepsy

Affiliations

Spatiotemporal dynamics of optogenetically induced and spontaneous seizure transitions in primary generalized epilepsy

Fabien B Wagner et al. J Neurophysiol. .

Abstract

Transitions into primary generalized epileptic seizures occur abruptly and synchronously across the brain. Their potential triggers remain unknown. We used optogenetics to causally test the hypothesis that rhythmic population bursting of excitatory neurons in a local neocortical region can rapidly trigger absence seizures. Most previous studies have been purely correlational, and it remains unclear whether epileptiform events induced by rhythmic stimulation (e.g., sensory/electrical) mimic actual spontaneous seizures, especially regarding their spatiotemporal dynamics. In this study, we used a novel combination of intracortical optogenetic stimulation and microelectrode array recordings in freely moving WAG/Rij rats, a model of absence epilepsy with a cortical focus in the somatosensory cortex (SI). We report three main findings: 1) Brief rhythmic bursting, evoked by optical stimulation of neocortical excitatory neurons at frequencies around 10 Hz, induced seizures consisting of self-sustained spike-wave discharges (SWDs) for about 10% of stimulation trials. The probability of inducing seizures was frequency-dependent, reaching a maximum at 10 Hz. 2) Local field potential power before stimulation and response amplitudes during stimulation both predicted seizure induction, demonstrating a modulatory effect of brain states and neural excitation levels. 3) Evoked responses during stimulation propagated as cortical waves, likely reaching the cortical focus, which in turn generated self-sustained SWDs after stimulation was terminated. Importantly, SWDs during induced and spontaneous seizures propagated with the same spatiotemporal dynamics. Our findings demonstrate that local rhythmic bursting of excitatory neurons in neocortex at particular frequencies, under susceptible ongoing brain states, is sufficient to trigger primary generalized seizures with stereotypical spatiotemporal dynamics.

Keywords: absence seizures; epilepsy; microelectrode arrays; optogenetics.


Figures

Fig. 1.
Fig. 1.
Combined microelectrode array (MEA) recordings and optogenetic stimulation in somatosensory (SI) cortex of freely moving rats. Implants for simultaneous optical stimulation and multisite recordings, assembled from 32-channel MEAs (A), 64-channel laminar probes (B), or both combined in an orthogonal configuration (C) are shown, all integrated with optical fibers (3 in B, 1 otherwise; see bright green spot where light exits the fiber). D: chronic implantation into SI cortex of WAG/Rij rat (AP, anteroposterior; ML, mediolateral). Image is from animal H12, implanted with a hybrid MEA/silicon probe. E: typical implantation site of planar MEAs (red square) assessed after brain extraction (from animal H10, >3 wk after implantation; filled green circle indicates optical fiber). Superimposed is a somatotopic map of rat SI and SII cortex [adapted with permission from Chapin and Lin (1984)]. F: histology revealed strong yellow fluorescent protein (EYFP) expression in deep cortical layers and electrode tracks left by array extraction (animal H10).
Fig. 2.
Fig. 2.
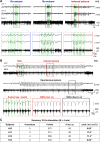
Optogenetically evoked cortical bursting can evolve into self-sustained seizures. A: 3 optical stimulation trials that failed (top left and top middle) or succeeded (top right) to induce a seizure, i.e., self-sustained spike-wave discharges (SWDs). Stimulation parameters: 10 Hz, 1-s train, 10-ms pulse width; light pulses indicated by vertical bars; optical power in the brain: ∼30 mW; data from H12, postimplantation day 14. Local field potentials (LFP; top 2 traces) and high-pass multiunit activity (MUA; bottom trace) are shown for representative electrodes. For each trial, a 2-s time window around the stimulation period is magnified (bottom). B: comparison between induced and spontaneous seizures (same stimulation parameters as in A; optical power in the brain: ∼50 mW; data from H10, postimplantation day 1). A 1-s period is magnified for optically evoked responses/bursts, SWDs during the induced seizure (ind. sz), and SWDs during the spontaneous seizure (spont. sz). SWDs during induced and spontaneous seizures were remarkably similar. Evoked bursts have a slightly different morphology. In both A and B, data are shown without application of an artifact removal algorithm. C: statistics of seizure induction following 10-Hz optical stimulation in 4 animals include (columns from left to right) number of recording sessions (∼8 h each) that were used for the analysis, number of stimulation trials at 10 Hz, number of 10-Hz stimulation trials that induced a seizure, and probability of seizure induction (prob. ind. sz), defined as the number of stimulation trials with induced seizures divided by the total number of trials (4th column divided by 3rd column), expressed as a percentage. Asterisks indicate a significant probability of seizure induction [P < 0.05, 1,000 Monte-Carlo surrogate data sets, false discovery rate (FDR) correction for multiple independent tests]. Stim., stimulation period.
Fig. 3.
Fig. 3.
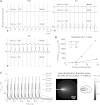
Seizures are induced optimally by stimulation frequencies around 10 Hz. A: probability of seizure induction as a function of stimulation frequency for 4 animals (1-s train, 10-ms pulse width for H11, H12, and H13 and ∼30-ms pulse width for H10, 6- to 18-Hz frequency). Data are pooled over day-long recording sessions (∼8 h each) with ∼100 trials per day per frequency (nstim: total no. of trials per frequency, depends on frequency; H10: 566 ≤ nstim ≤ 626; H11: 272 ≤ nstim ≤ 333; H12: 353 ≤ nstim ≤ 385; H13: 370 ≤ nstim ≤ 430). Black asterisks indicate a significant probability of seizure induction (P < 0.05, 1,000 Monte Carlo surrogate data sets, FDR correction for multiple dependent tests). Gray asterisks above brackets indicate significantly different probabilities of seizure induction between 2 frequencies (P < 0.05, 1,000 random permutations, FDR correction for dependent tests). Only nonredundant significant comparisons are shown. Multiple tests correction includes all tests depicted. Optical powers: 30–80 mW (H10: 80 mW; H11: 50 mW; H12: 30 mW; H13: 30-30-40-80 mW). B: summary across subjects. Each gray curve represents data from one of the animals shown in A. The black curve represents the mean across animals for frequencies between 6 and 16 Hz.
Fig. 4.
Fig. 4.
Optical stimulation evokes bursting and induces seizures only after opsin expression. A: trial-averaged LFPs at different times postinjection, for 3 animals (H13, C2, C3) injected and implanted within the same surgery, show that optically evoked responses appeared after 15–30 days (average taken over trials with no seizure). For H13 on day 9, the detected seizure was likely a coincidence, based on visual inspection of the original data. Artifact removal was systematically applied to all data. Shape differences likely come from different distances and depths with respect to the fiber (H13: silicon probe a few mms away from fiber; C2 and C3: microwires aligned with fiber). B: summary showing that LFP responses to optical stimulation were absent shortly after viral injections and developed over time as the opsin expressed. Neural signal energy was defined as the square of the LFP signal, averaged across trials and over time during either the 1-s stimulation period or a baseline period preceding stimulation. The change in energy (Δenergystim − baseline) was defined as the energy difference between stimulation and baseline divided by the energy during baseline, expressed as a percentage. All 3 curves increase by several orders of magnitude over a few weeks postinjection. The curve corresponding to H13 is below the curves for C2 and C3, potentially because the electrodes were located farther away from the fiber in H13 compared with C2 and C3. C: simulations of light-induced heating. Left, temperature increase at the fiber tip (where heating is largest, ΔTmax) as a function of time for different optical powers and pulse widths for 10 pulses delivered at 10 Hz. Right, spatial distribution of temperature changes for the worst scenario on the left (80 mW, 30 ms). The largest temperature changes were restricted to an area of 50 × 50 × 200 μm (fiber diameter: 50 μm) and did not exceed 1–2°C.
Fig. 5.
Fig. 5.
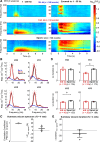
Induced and spontaneous seizures have the same spectral characteristics and comparable average durations. All examples are from stimulation at 10 Hz with 10-ms pulses (H11, H12, and H13: same data sets as in Fig. 3). A: average LFP multitaper spectrograms for the 3 types of events: stimulation trials with no seizure (no sz; blue), stimulation trials with induced seizures (ind. sz; red), and spontaneous seizures (spont. sz; black) (1 representative electrode from H11: left, 1–300 Hz; right, magnified, 1–30 Hz; n, no. of events). Power for each frequency (P) was normalized by its average value in the 2-s window preceding trials with no seizure (P0). Solid black lines indicate the beginning and end of stimulation; dotted black lines indicate average duration of induced or spontaneous seizures (computed independently, based on amplitude features). B: electrode-averaged multitaper power spectral density (PSD) computed between 1.5 and 2.5 s after event onset (white dotted lines from A) for trials with no seizure (blue), trials with induced seizures (red), and spontaneous seizures (black). Solid lines indicate mean across trials; shaded areas represent 95% confidence interval of the mean (bootstrap). Dotted lines indicate 5 and 12 Hz. C: summary of PSD similarity analysis between induced and spontaneous seizures for all 4 animals. Left, correlation coefficient between the PSDs of induced and spontaneous seizures was computed (each dot represents 1 animal). The mean across animals (thick horizontal line) is close to 1, indicating a nearly perfect correlation. Right: total LFP power was computed by integrating the PSD over frequencies between 1 and 300 Hz. The relative change in power between induced and spontaneous seizures (ΔPind − spont), expressed as a percentage, is represented (each dot represents 1 animal, thick line indicates mean across subjects, error bars indicate 95% confidence interval of the mean). Note that the 95% confidence interval includes zero. D: comparison of the mean duration of induced and spontaneous seizures (Δdurationind − spont) within each animal. Error bars indicate 95% confidence interval obtained by bootstrap. *P < 0.05 (Welch's t-test with FDR correction for independent tests). E: summary of seizure durations across animals. Each dot represents the mean seizure duration for a given animal, the thick line indicates mean across animals, and error bars indicate the 95% confidence interval of the mean.
Fig. 6.
Fig. 6.
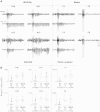
Seizures can also be induced in another rat strain, provided animals have spontaneous seizures. A: trial with maximum 5- to 12-Hz power among trials that failed (no sz; top trace for each animal) or succeeded (ind. sz; bottom trace) to induce a seizure, shown for 2 rat strains: WAG/Rij (n = 4) and Wistar (n = 4). Two of the Wistar rats did not show any sign of self-sustained trains of SWDs, even for the trial with the highest 5- to 12-Hz power. Interestingly, these 2 rats did not show any spontaneous seizure-like event either. B: distribution of the 5- to 12-Hz LFP power (frequency band shown in Fig. 5B, 1.5–2.5 s after event onset) for the 3 event types no sz, ind. sz, and spont.sz (n = no. of events). Box plots indicate the median and 25th and 75th percentiles of the distribution; whiskers extend to the lowest and highest data within 1.5 times the interquartile range of the lower and upper quartiles, whereas outliers are represented individually. In both WAG/Rij and Wistar rats with seizures, power in this band was a good marker of induced and spontaneous seizures. Note that we were conservative in our definition of induced seizures, as shown by the outliers in the “no sz” category.
Fig. 7.
Fig. 7.
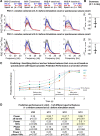
Ongoing LFP oscillations before stimulation onset predict whether optical stimulation induces a seizure. Data are from same data sets as in Fig. 5. A: multitaper PSDs at different times preceding stimulation onset or spontaneous seizures, shown for all 4 animals (n = no. of events). B: summary of total spectral power differences between trials that succeeded (ind. sz; red) or failed (no sz; blue) to induce a seizure (ΔPind sz − no sz). The total LFP power was computed by integrating the PSD over frequencies between 1 and 300 Hz (each dot represents 1 animal, thick line indicates mean across subjects, and error bars indicate 95% confidence interval of the mean). Top and bottom plots correspond to different time periods, respectively 4 to 3 s and 1 to 0 s before stimulation onset. C: we used support vector machines (SVMs) to determine whether LFP features immediately preceding (ongoing activity) or during the stimulation period (evoked activity) could predict if a seizure would be induced (ind. sz) or not (no sz) after the optical stimulation ended in any given stimulation trial. For completeness, we also assessed how well the trained SVM could discriminate (classify) between induced and no induced seizure states as based on the LFP features during the period immediately following the end of the optical stimulation. The solid lines (colors indicate animals H10–H13) show the prediction performance, which ranges from 0 to 1, with 0 representing random and 1 perfect performance. The prediction performance was assessed at consecutive 1-s time intervals, centered at the times indicated by the filled circles. This prediction performance should be compared to the corresponding 95% chance level (dotted lines, color matched) obtained by randomly shuffling the categories “ind. sz” and “no sz” in 100 random permutations (no multiple test correction; see D for hypothesis testing with FDR correction). Prediction performance was above the 95% chance level for all animals during the 1-s time period immediately preceding the optical stimulation and further increased during the stimulation period itself (denoted by the 2 vertical lines), indicating that ongoing states and neural excitation reflected in LFP features can predict whether a seizure will be induced or not. In 2 of the animals (H11 and H13), prediction performance was above chance for several seconds before stimulation onset. During the 1-s period immediately following the end of the stimulation, SVMs achieved, not surprisingly, nearly perfect discrimination/classification of whether an induced seizure had happened or not. The LFP features included the spectral power in 8 frequency bands at different 1-s time periods corresponding to before, during, and after stimulation as described above. The 8 frequency bands spanned the 1- to 300-Hz frequency range [the first 4 bands (delta, theta, alpha, beta) are indicated in A by the vertical dotted lines] during nonoverlapping 1-s-long windows. (See also materials and methods, Spectral analysis and Prediction performance of neural signals, for more details on power estimation and on how SVMs were trained.) The prediction performance at each examined time was defined as 2 × AUC − 1, where AUC corresponds to the area under the receiver operating characteristic (ROC) curve, which is a standard measure used for assessment of prediction and classification performance. Results were obtained with repeated 10-fold cross-validation (10 repetitions). Each filled circle represents the mean of the prediction performance across all repetitions. D: prediction performance based on different spectral features during the 1-s period preceding stimulation, associated nonadjusted P values (i.e., before FDR correction) computed by random permutation tests (1,000 permutations), and significance after FDR correction for multiple testing (yellow highlighting: *P < 0.05 after FDR correction for dependent tests). First to fourth rows: Power all bands, power in all 8 frequency bands as before; Power 10 Hz, power in a narrow band between 9 and 11 Hz; Phase 10 Hz, phase at the same frequency; Power + Phase 10 Hz, combination of power and phase at 10 Hz.
Fig. 8.
Fig. 8.
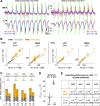
Increased sensitivity to repeated stimulation at 10 Hz is an excellent predictor of seizure induction. Data are from same data sets as in Figs. 5 and 7. A: trial-averaged LFPs and multiunit activity envelope (eMUA) (data from H12, 2 consecutive days, n = no. of events). eMUA peaks represent bursts of activity, larger for stimulation trials inducing seizures. Green bars indicate light stimulation. Shaded areas represent 95% confidence interval (bootstrap). B: scatter plots of LFP and eMUA amplitudes for different electrodes quantified for the first peak (gray, along diagonal) and maximum peak in the series (orange, above diagonal) (data from H10 and H12). Each dot represents mean across trials for 1 electrode. Shaded areas represent 95% confidence ellipse (bootstrap). C: similar analysis for 1 particular electrode in each animal (LFP only). Electrode with best separation between “ind. sz” and “no sz” for maximum peak is shown. Error bars indicate 95% confidence interval (bootstrap). *P < 0.05 (Welch's t-test, FDR correction for dependent tests.) D: summary of data in C across animals. Each dot represents the relative change in mean amplitude between trials with and without induced seizures (ΔVind sz − no sz) for either the first peak or the maximum peak in a given animal. Thick line indicates mean across animals. Error bars indicate 95% confidence interval. E: prediction performance for discriminating stimulation trials with and without induced seizures (as in Fig. 7D), based on first and maximum peak amplitudes. *P < 0.05 (1,000 permutations, FDR corrected for dependent tests).
Fig. 9.
Fig. 9.
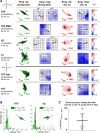
Example illustrating the contributions of direct light stimulation and network mechanisms to optically evoked bursts and SWDs during induced seizures. A, left: trial-averaged LFPs and eMUA from 2 electrodes (data from H10). Top electrode: the averaged eMUA has 2 peaks after the 2nd light pulse, especially during trials with induced seizures (red). Bottom electrode: only 1 peak for each light pulse. Shown at right are delay maps of early (top) and late (bottom) eMUA peaks, averaged across all light pulses (gray area indicates undefined peak). A peak in the eMUA was defined as “early” if it occurred during the 10-ms light pulse or 2 ms after its end and was defined as “late” otherwise. Light stimulation affected 7–12 electrodes with short latencies. Network effect was more widespread and originated from a different location. B: LFP wave examples recorded from H10 during trials with induced seizures. Heat maps represent instantaneous LFP amplitudes across the array at different times (t = 0, negative population peak; arrow indicates direction of propagation using optical flow algorithm). Top, wave following light stimulation (10-ms pulse starting at t = −15 ms) originating from directly activated regions. Bottom, wave propagating in the opposite direction, recorded during the self-sustained SWDs following stimulation but sometimes seen during the stimulation period, as well (see also Supplemental Movie 2).
Fig. 10.
Fig. 10.
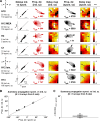
Propagation of optically evoked responses and subsequent SWDs during induced seizures suggests the indirect recruitment of a hyperexcitable network. Data are from same data sets as before for H10–H13. A: statistical analysis of LFP wave propagation across animals. Angle histograms summarize directions of propagations across all discharges (nspk = total no. of discharges, or “spikes,” detected as negative threshold crossings in the LFPs; area of each bar represents no. of discharges propagating in a given direction; arrow indicates angular mean). Average amplitude maps at a particular time (10 to 15 ms) before the global discharge peak are shown. For animals with bidirectional propagation (H10 and H2), results are shown independently for each direction (dir1 and dir2). H12 lam. and H13 were implanted with laminar probes, and all others with planar MEAs. Additional animals included C1 (epileptic Wistar rat) and H2 (from preliminary experiments, injected with a different virus; see materials and methods). Initiation sites and directions of propagation usually differ between optically evoked responses and subsequent self-sustained SWDs during induced seizures. DV, dorsoventral. B: histograms of latencies between LFP discharges and light onset for animals with bidirectional propagation during stimulation (H10 and H2, as shown in A). Dark green bars indicate discharges propagating in the first direction (dir.1, waves from stimulated area); white bars indicate the second direction (dir.2, waves from natural network). Angle histograms show propagation directions as a reminder. In both animals, discharges propagating in the second direction are less phase-locked with the stimulus (more discharges with latencies above 50 ms) than discharges propagating in the first direction, likely reflecting a response of the network, which tends to oscillate at its own frequency. C: the mean direction of propagation was computed for each array as shown in A (except for C1, where there was no clear propagation during stimulation). The difference (in absolute value) in the mean direction of propagation between the stimulation periods and the subsequent induced seizures (Δdirectionind sz − stim) is represented. Each dot represents 1 array (for animals with bidirectional wave propagation, we show 1 dot for each direction). Thick line indicates mean across arrays. Error bars indicate 95% confidence interval. This graph shows that there was an overall change in the direction of propagation between the stimulation periods and the induced seizures. This still holds for C1, where a clear propagation was observed during the induced seizures, but not during stimulation.
Fig. 11.
Fig. 11.
SWDs during induced and spontaneous seizures propagate similarly, likely indicating that they are generated by the same epileptogenic network. Data are from same data sets as in Fig. 10. A: scatter plots (far left) depict delays of SWDs during induced (τind) and spontaneous (τspont) seizures. Each dot represents mean across SWDs for each electrode (nspk = total no. of SWDs, detected as negative threshold crossings in the LFPs). Shaded areas indicate 95% confidence regions (bootstrap). The same delays are plotted topographically as heat maps (arrow indicates angular mean of the propagation direction histograms, obtained independently). Angle histograms show propagation directions consistent between SWDs during induced and spontaneous seizures. Note origin from deep and posterior sites on laminar probes (H12-lam and H13). B: scatter plot comparing the directions of propagation during spontaneous and induced seizures. Each circle represents 1 array; filled and open circles correspond to planar and laminar arrays, respectively. All lie along the diagonal. C: summary of differences between the directions of propagation during spontaneous and induced seizures (Δdirectionind sz − spont), represented as in Fig. 10C. Note also that the directional differences here are much smaller than in Fig. 10C.

Similar articles

Cited by

References

    1. Benjamini Y, Hochberg Y. Controlling the false discovery rate: a practical and powerful approach to multiple testing. J R Stat Soc Series B Stat Methodol 57: 289–300, 1995.
    1. Benjamini Y, Yekutieli D. The control of the false discovery rate in multiple testing under dependency. Ann Stat 29: 1165–1188, 2001.
    1. Bernier GP, Richer F, Giard N, Bouvier G, Mercier M, Turmel A, Saint-Hilaire JM. Electrical stimulation of the human brain in epilepsy. Epilepsia 31: 513-52, 1990. - PubMed
    1. Blume WT, Jones DC, Pathak P. Properties of after-discharges from cortical electrical stimulation in focal epilepsies. Clin Neurophysiol 115: 982–989, 2004. - PubMed
    1. Blumenfeld H, McCormick DA. Corticothalamic inputs control the pattern of activity generated in thalamocortical networks. J Neurosci 20: 5153–5162, 2000. - PMC - PubMed

Publication types

LinkOut - more resources