. 2015 Apr 15;24(8):2163-74.
doi: 10.1093/hmg/ddu736. Epub 2014 Dec 30.

Neurofilament light polypeptide gene N98S mutation in mice leads to neurofilament network abnormalities and a Charcot-Marie-Tooth Type 2E phenotype

Affiliations

Neurofilament light polypeptide gene N98S mutation in mice leads to neurofilament network abnormalities and a Charcot-Marie-Tooth Type 2E phenotype

Adijat A Adebola et al. Hum Mol Genet. .

Abstract

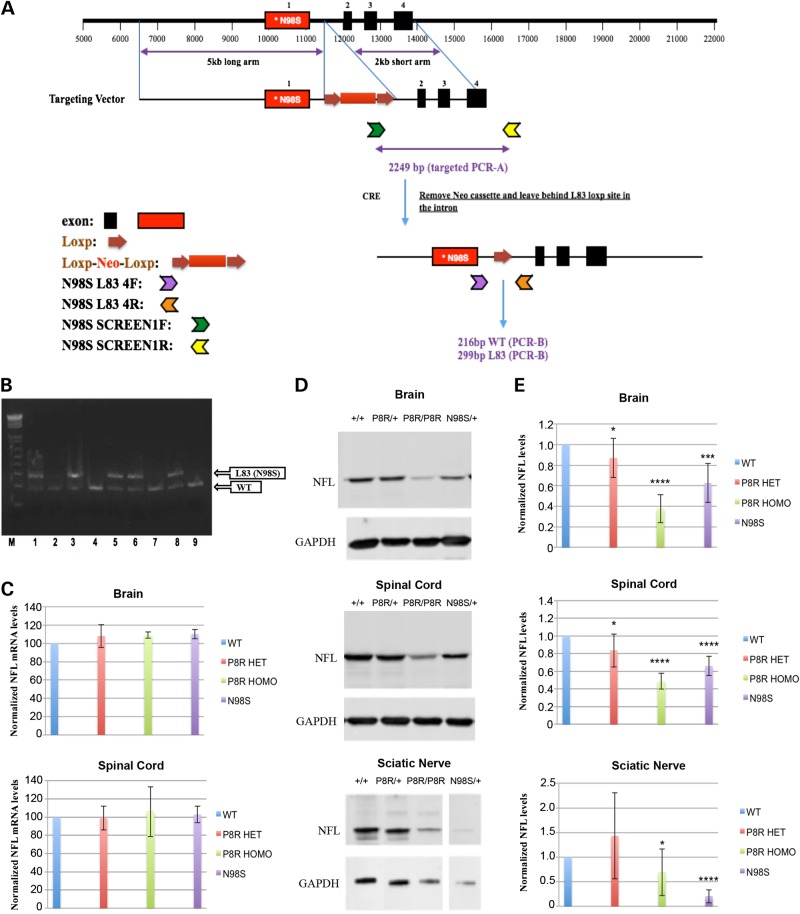
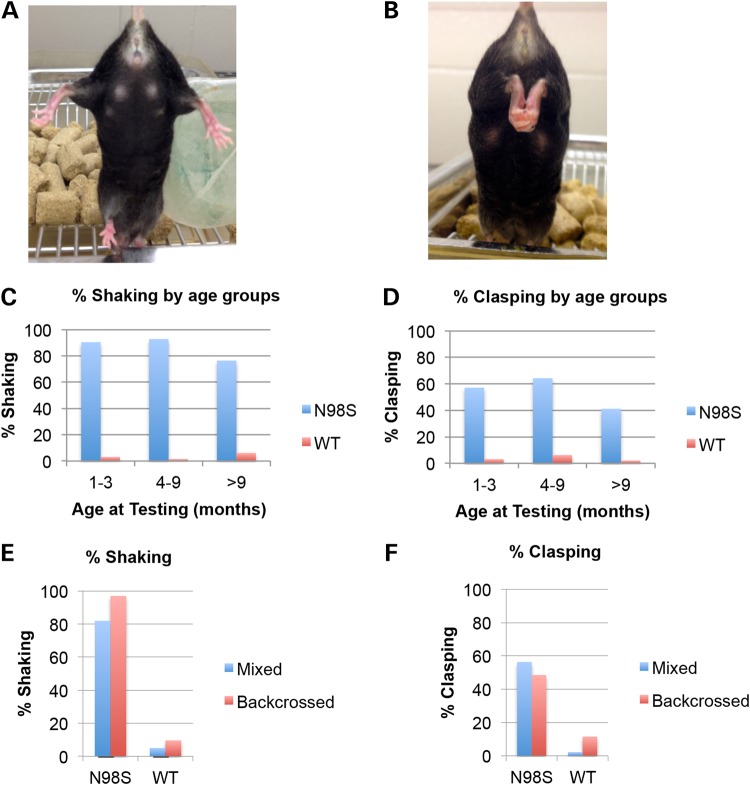
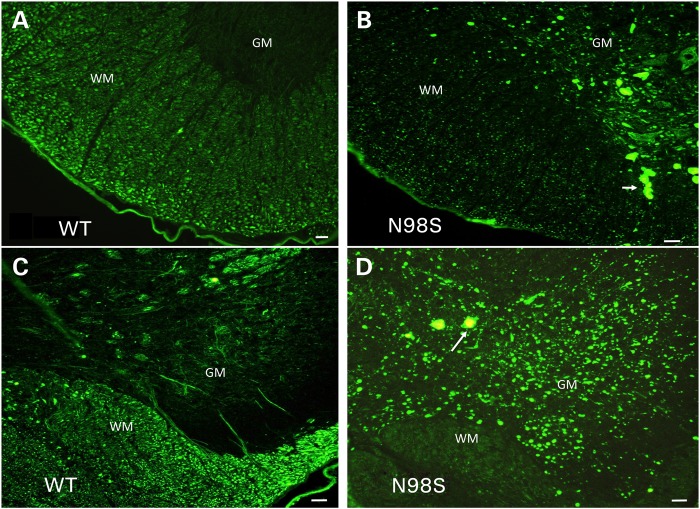
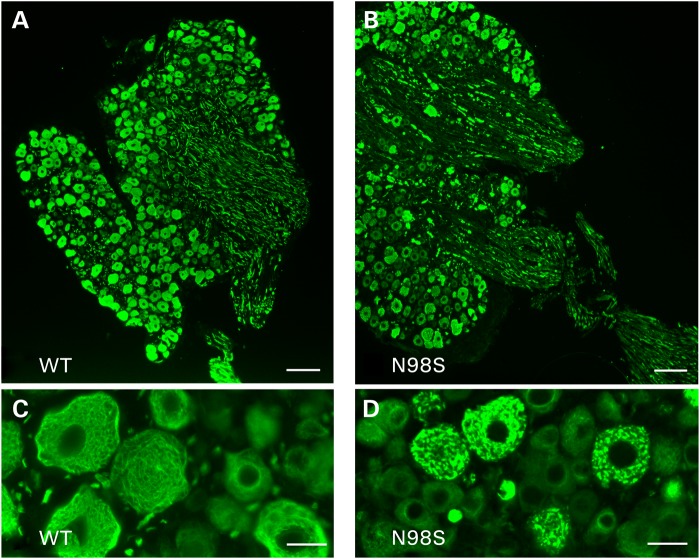
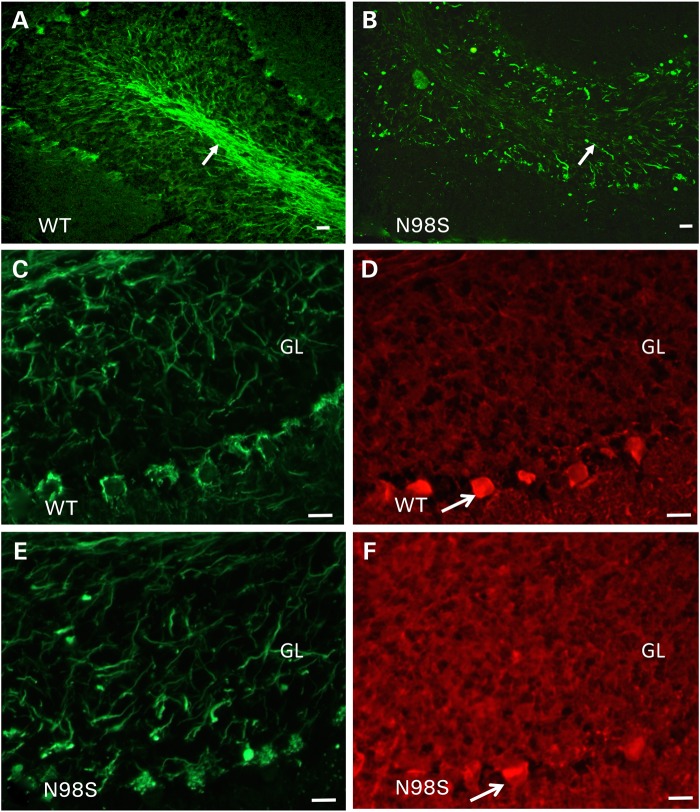
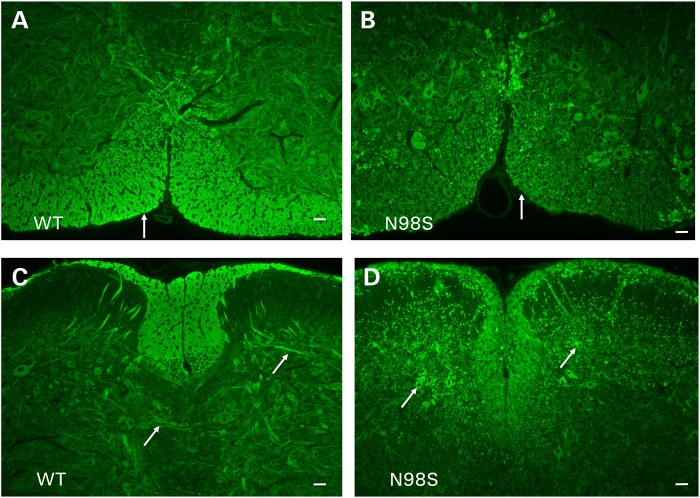
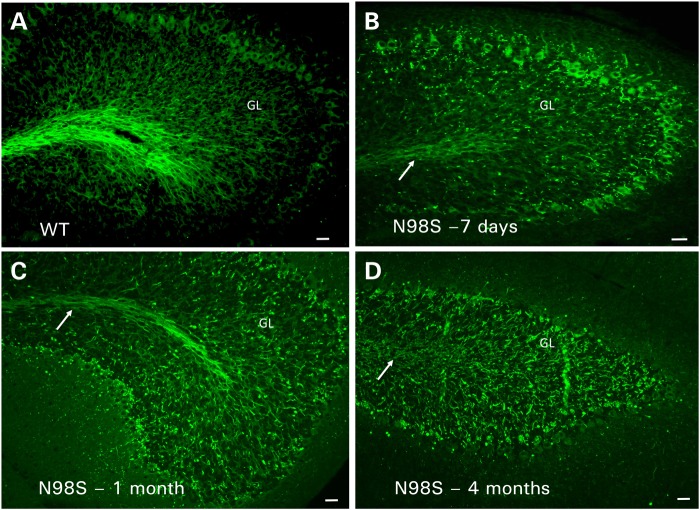
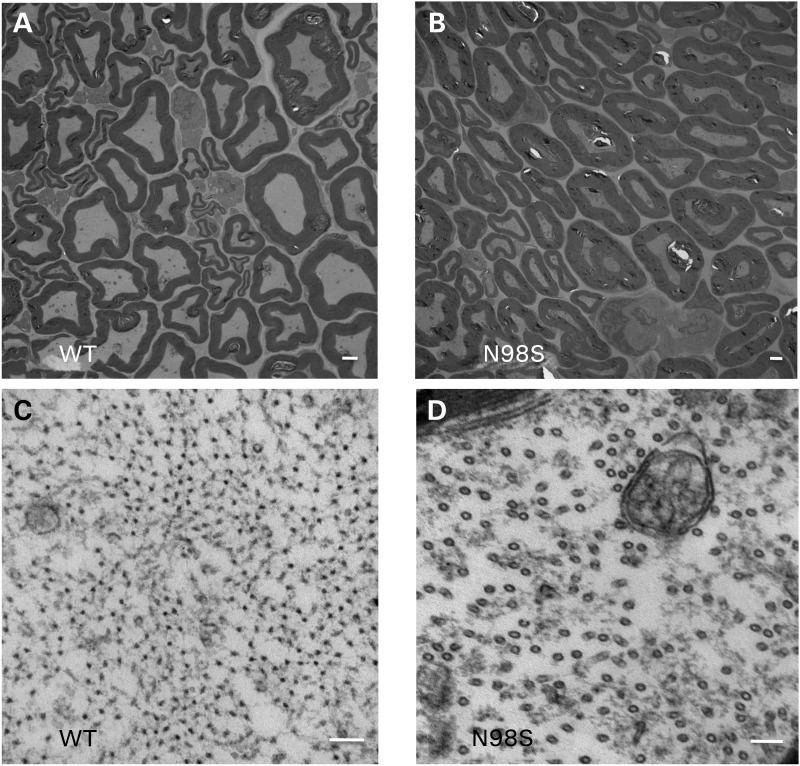
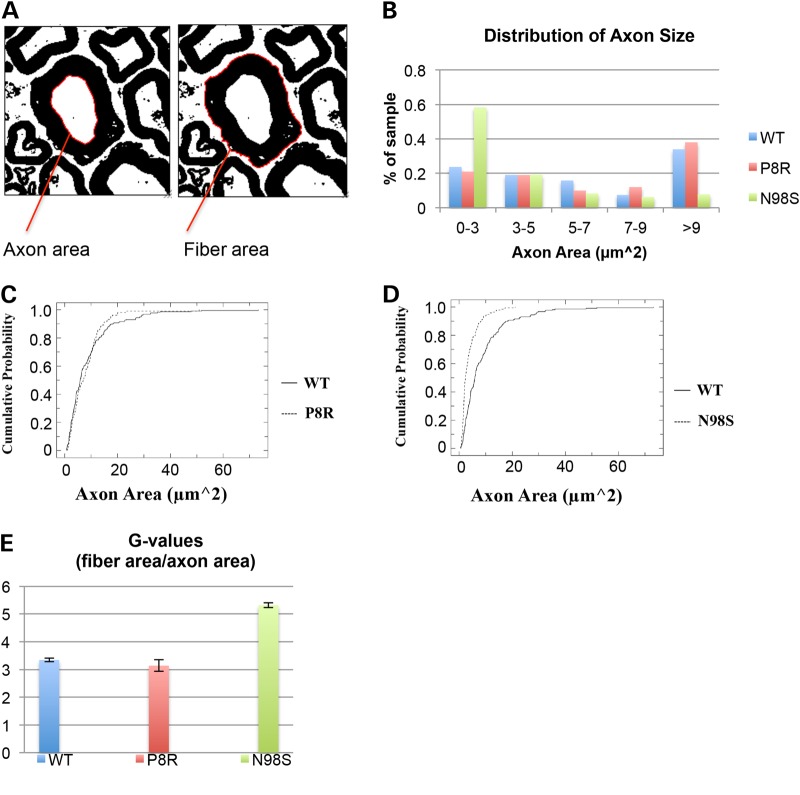
Charcot-Marie-Tooth disease (CMT) is the most commonly inherited neurological disorder with a prevalence of 1 in 2500 people worldwide. Patients suffer from degeneration of the peripheral nerves that control sensory information of the foot/leg and hand/arm. Multiple mutations in the neurofilament light polypeptide gene, NEFL, cause CMT2E. Previous studies in transfected cells showed that expression of disease-associated neurofilament light chain variants results in abnormal intermediate filament networks associated with defects in axonal transport. We have now generated knock-in mice with two different point mutations in Nefl: P8R that has been reported in multiple families with variable age of onset and N98S that has been described as an early-onset, sporadic mutation in multiple individuals. Nefl(P8R/+) and Nefl(P8R/P8R) mice were indistinguishable from Nefl(+/+) in terms of behavioral phenotype. In contrast, Nefl(N98S/+) mice had a noticeable tremor, and most animals showed a hindlimb clasping phenotype. Immunohistochemical analysis revealed multiple inclusions in the cell bodies and proximal axons of spinal cord neurons, disorganized processes in the cerebellum and abnormal processes in the cerebral cortex and pons. Abnormal processes were observed as early as post-natal day 7. Electron microscopic analysis of sciatic nerves showed a reduction in the number of neurofilaments, an increase in the number of microtubules and a decrease in the axonal diameters. The Nefl(N98S/+) mice provide an excellent model to study the pathogenesis of CMT2E and should prove useful for testing potential therapies.


Figures

Figure 1.
Figure 1.
Generation of Nefl P8R and N98S knock-in mice. (A) Strategy for generating the knock-in mice: a targeting vector containing the point mutation in the first exon of Nefl, and a Loxp-Neo-Loxp cassette inserted in the first intron was constructed and used to generate the knock-in mice. The targeted allele could be differentiated from the WT allele by PCR using the 4F and 4R primers. (B) Ethidium bromide-stained agarose gel of PCR analyses of the F1 mice showing the WT and targeted (L83 (N98S)) alleles; five of the nine animals showed both alleles, the other four were WT. (C) RNA was isolated from brains and spinal cords of Nefl+/+, NeflP8R/+ NeflP8R/P8R and NeflN98S/+ mice and the amount of NFL mRNA was quantified by RT–PCR and compared with glyceraldehyde 3-phosphate dehydrogenase (GAPDH) mRNA. Ratios of NFL mRNA and GAPDH mRNA for the different genotypes are shown. Experiments were repeated with three sets of animals. (D) Western blots of brain, spinal cord and sciatic nerve from Nefl+/+, NeflP8R/+, NeflP8R/P8R and NeflN98S/+ probed with anti-NFL-N antibody and anti-GAPDH. (E) Ratios of NFL/GAPDH from the western blots shown in D. (Brain: Nefl+/+: n = 10; NeflP8R/+: n = 9; NeflP8R/P8R: n = 10; NeflN98S/+: n = 9; Spinal cord: Nefl+/+: n = 10; NeflP8R/+: n = 9; NeflP8R/P8R: n = 10; NeflN98S/+: n = 9; Sciatic nerve: Nefl+/+: n = 9; NeflP8R/+: n = 8; NeflP8R/P8R: n = 9; NeflN98S/+: n = 7). Significance was calculated using a one-tailed, type 3 t-test in excel (*P ≤ 0.05, ***P ≤ 0.001, ****P ≤ 0.0001).
Figure 2.
Figure 2.
Abnormal hindlimb posturing and tremor in NeflN98S/+ mice. (A) Photograph of Nefl+/+ mouse showing normal hindlimb posturing when suspended by its tail. (B) Photograph of NeflN98S/+ mouse showing abnormal hindlimb posturing (clasping) when suspended by its tail. (C) Percentages of NeflN98S/+ mice (blue bars) and Nefl+/+ (WT) mice (red bars) that were shaking in different age groups. (D) Percentages of NeflN98S/+ mice (blue bars) and Nefl+/+ (WT) mice (red bars) demonstrating hindlimb clasping in different age groups. (E) Blue bars: percentage of mice that were shaking before backcrossing to C57Bl6 mice five times; red bars: percentage of mice that were shaking after backcrossing five times. The proportion of NeflN98S/+ mice that exhibited shaking increased after backcrossing. (F) Red bars: percentage of mice showing hindlimb clasping before backcrossing to C57Bl6 mice five times; red bars: percentage of mice that show hindlimb clasping after backcrossing. (NeflN98S/+: before backcrossing n = 71, after backcrossing n = 33; Nefl+/+: before backcrossing n = 179; after backcrossing, n = 52).
Figure 3.
Figure 3.
Immunofluorescence micrographs of sections of spinal cord stained with anti-NFL-N antibody showing inclusions in NeflN98S/+ mice. (A) Section of anterior horn of 18-month-old Nefl+/+ (WT) mouse. (B) Section of anterior horn of 18-month-old NeflN98S/+ (N98S) mouse. (C) Section of posterior horn of 18-month-old Nefl+/+ (WT) mouse. (D) Section of posterior horn of 18-month-old mutant NeflN98S/+ (N98S) mouse. WM of Nefl+/+ mice shows axonal labeling, whereas there is relatively little labeling in the cell bodies of the GM in both the anterior and posterior horns. In contrast, there was relatively little labeling in the WM of NeflN98S/+ mice, except for the inclusions (arrow), which are likely due to axonal swellings. Inclusions are also observed in the GM in both the anterior and posterior sections (arrows). Bars = 50 μm.
Figure 4.
Figure 4.
Immunofluorescence of sections of dorsal root ganglia showing abnormalities in NeflN98S/+ mice. (A and C) Labeling of dorsal root ganglia of WT mice; (B and D) Labeling of dorsal root ganglia of NeflN98S/+ mice. The cell bodies of the DRGs are stained with anti-NFL, and aggregates in the cell bodies can clearly be seen in the sections from the NeflN98S/+ mice. The processes from the NeflN98S/+ mice show a discontinuous staining with apparent aggregates. Bars (A and B) = 100 µm; (C and D) = 25 µm.
Figure 5.
Figure 5.
Immunofluorescence micrographs of sections of cerebellum showing abnormalities in NeflN98S/+ mice. (A) Labeling of the cerebellum of 18-month-old Nefl+/+ (WT) mouse with anti-NFL-N antibody. (B) Labeling of the cerebellum of 18-month-old NeflN98S/+ (N98S) mouse with anti-NFL-N antibody. Note labeling of the WM tract in the Nefl+/+ mouse compared with the irregular labeling and the absence of the WM tract in the cerebellum of the NeflN98S/+ mouse (arrows in A and B). There are also abnormal processes in the granular layer (GL) in the cerebellum of the NeflN98S/+ mouse. (C and D) Double labeling of cerebellar section from 18-month old Nefl+/+ mouse with anti-NFL-N (green) and anti-calbindin (red) antibodies. (E and F) Double labeling of cerebellar section from 18-month-old Nefl+/+ mouse with anti-NFL-N (green) and anti-calbindin (red) antibodies. Arrows indicate labeling of basket cell axons around the Purkinje cells in WT mice (C). In NeflN98S/+ mice, note the absence of basket cell process labeling (arrow) and the swellings in the GL of the cerebellum (E). The absence of calbindin labeling (F) suggests that they are not Purkinje cell processes but rather disordered basket cell processes. Bars = 50 μm.
Figure 6.
Figure 6.
Immunofluorescence micrographs showing labeling of a post-natal day 7 spinal cords of Nefl+/+ (WT) and NeflN98S/+ (N98S) with anti-NFL-N antibody. (A) Section of anterior horn from Nefl+/+ mouse. (B) Section of anterior horn from NeflN98S/+ mouse. (C) Section of posterior horn from Nefl+/+ mouse. (D) Section of posterior horn from NeflN98S/+ mouse. Arrows in A and B indicate the abundant axonal labeling of the WM of the Nefl+/+ sections, which is reduced in the NeflN98S/+ sections. In the GM, axonal tracts can be observed in Nefl+/+ sections (arrows, C), whereas prominent cell body labeling is observed in the posterior horn section from the NeflN98S/+ mouse (arrows, D). Bars = 50 μm.
Figure 7.
Figure 7.
Immunofluorescence micrographs showing labeling with anti-NFL-N antibody of sections of cerebella from Nefl+/+ and NeflN98S/+ mice of various ages. (A) Section of cerebellum from a 7-day-old Nefl+/+ (WT) mouse. (B) Section of cerebellum from a 7-day-old NeflN98S/+ (N98S) mouse. (C) Section of cerebellum from a 1-month-old NeflN98S/+ (N98S) mouse. (D) Section of cerebellum from a 4-month-old NeflN98S/+ (N98S) mouse. GL, granular layer. Arrows point to the white matter tracts. Bar = 50 μm.
Figure 8.
Figure 8.
Electron micrographs of sciatic nerves from Nefl+/+ and NeflN98S/+ mice. (A and B) Low power views of section of sciatic nerves from Nefl+/+ mouse (A, WT) and NeflN98S/+ mouse (B, N98S). (C and D). High power views of sciatic nerves from Nefl+/+ mouse (C, WT) and NeflN98S/+ mouse (D, N982). At low power (A and B), differences in axon diameter can be observed. At high power (C and D), neurofilaments can be seen in the section from the Nefl+/+ mouse (C, shown in cross-section) that are missing in the sections from the NeflN98S/+ mouse, where they are replaced with microtubules (D). Three sets of animals were analyzed. Bars A and B = 2 μm; C and D = 100 μm.
Figure 9.
Figure 9.
Axon size distribution and g-ratios based on the electron micrographs. (A) G ratio = fiber area/axon area. Axon and fiber areas were measured using the magic wand tool set to scale in ImageJ. (B) Nefl+/+ and NeflP8R/+ mice show similar distribution of axon sizes, with axons >9 µm2 occupying the greatest percentage of the sample measured. NeflN98S/+ mice show a different pattern of axon size distribution, with a greater percentage of axons with smaller areas. (C) Cumulative distribution of axon areas measured in Nefl+/+ and NeflP8R/+ mice. The distributions are not significantly different (Kolmogorov–Smirnov KS test P > 0.05). (D) Cumulative distribution of axon areas measured in Nefl+/+ and NeflN98S/+ mice. The distributions are significantly different (Kolmogorov–Smirnov KS test P < 0.001). (E) Nefl+/+ and NeflP8R/+ mice show similar g-ratios axon sizes. NeflN98S/+ mice show a much higher g-ratio, indicating that there is more myelin on the axons of the NeflN98S/+ mutant mice; Nefl+/+ n = 215, NeflN98S/+ n = 192, and NeflP8R/+ n = 100. Data were pooled from the results from three different mice.

References

    1. Liem R.K., Messing A. (2009) Dysfunctions of neuronal and glial intermediate filaments in disease. J. Clin. Invest., 119, 1814–1824. - PMC - PubMed
    1. Shy M.E., Patzko A. (2011) Axonal Charcot-Marie-Tooth disease. Curr. Opin. Neurol., 24, 475–483. - PubMed
    1. Suter U., Scherer S.S. (2003) Disease mechanisms in inherited neuropathies. Nat. Rev. Neurosci., 4, 714–726. - PubMed
    1. Dyck P.J., Lambert E.H. (1968) Lower motor and primary sensory neuron diseases with peroneal muscular atrophy. II. Neurologic, genetic, and electrophysiologic findings in various neuronal degenerations. Arch. Neurol., 18, 619–625. - PubMed
    1. Dyck P.J., Lambert E.H. (1968) Lower motor and primary sensory neuron diseases with peroneal muscular atrophy. I. Neurologic, genetic, and electrophysiologic findings in hereditary polyneuropathies. Arch. Neurol., 18, 603–618. - PubMed

Publication types

Substances

Supplementary concepts