Review
. 2015 Jan 2;116(1):150-66.
doi: 10.1161/CIRCRESAHA.116.303595.

Origin of cardiomyocytes in the adult heart

Affiliations
Review

Origin of cardiomyocytes in the adult heart

Annarosa Leri et al. Circ Res. .

Erratum in

  • Correction.
    [No authors listed] [No authors listed] Circ Res. 2015 Dec 4;117(12):e133. doi: 10.1161/RES.0000000000000081. Circ Res. 2015. PMID: 26635387 No abstract available.

Abstract

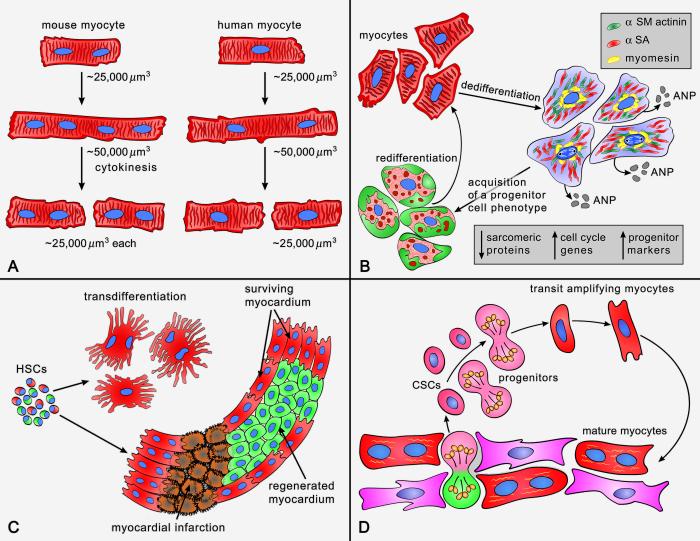
This review article discusses the mechanisms of cardiomyogenesis in the adult heart. They include the re-entry of cardiomyocytes into the cell cycle; dedifferentiation of pre-existing cardiomyocytes, which assume an immature replicating cell phenotype; transdifferentiation of hematopoietic stem cells into cardiomyocytes; and cardiomyocytes derived from activation and lineage specification of resident cardiac stem cells. The recognition of the origin of cardiomyocytes is of critical importance for the development of strategies capable of enhancing the growth response of the myocardium; in fact, cell therapy for the decompensated heart has to be based on the acquisition of this fundamental biological knowledge.

Keywords: cell dedifferentiation; cell transdifferentiation; stem cells.


Figures

Figure 1
Figure 1. Potential mechanisms of cardiomyogenesis
See text.
Figure 2
Figure 2. Cycling and dividing cardiomyocytes
A, PCNA is expressed in several nuclei (arrowheads) of human fetal myocardium collected at autopsy. B, Nuclear localization of PCNA in cardiomyocytes (arrows) of a human heart with ischemic cardiomyopathy. PCNA was detected by alkaline phosphatase streptavidin labeling and α-sarcomeric actin (α-SA) by immunoperoxidase. C, Dividing human myocyte located in the border zone of a patient who died as a result of an extensive myocardial infarct. Hematoxylin and eosin staining. D, Mitotic image in a myocyte of a human heart with ischemic cardiomyopathy. Myofibrils, α-SA (light brown); nuclei, hematoxylin (blue). Scale bars, 10 μm. Adapted from reference 25.
Figure 3
Figure 3. Heterogeneity of the myocyte cell population in wild-type and Terc−/− mice at the second (G2) and fifth (G5) generation
A, Frequency distribution of telomere length in wild-type, G2 Terc−/− and G5 Terc−/− mice (open bars). The corresponding values for each subclass of nuclei expressing p53 are shown by solid bars. B through D, Defects in the telomere-telomerase axis impinge upon myocyte apoptosis and proliferation. Results are means ± SD. * and †, P < 0.05 versus WT and G2, respectively. Adapted from reference 44.
Figure 4
Figure 4. Telomere length and telomerase activity in cardiomyocytes
A, Distribution of myocyte cross-sectional area (CSA) and telomere length. Aging in wild type mice results in a shift in the distribution of CSA to the right and telomere length to the left. The solid portion of the bars corresponds to p16INK4a-positive myocyte nuclei; they increase with age in both cases. In transgenic mice carrying IGF-1 under the control of the α-MHC promoter, these changes are attenuated. B, Catalytic subunit of telomerase (TERT) in myocyte nuclear lysates. C, Products of telomerase activity start at 50 bp and display a 6-bp periodicity. Myocytes treated with RNase (+) were used as negative control and HeLa cells as positive control. Adapted from reference 45. D, In failing human hearts, chromatin bridges, indicative of abortive mitosis, were detected between dividing myocyte nuclei, reflecting senescent cells unable to replicate (Courtesy of Dr. Shao-Min Yan and Prof. Alberto C. Beltrami, University of Udine, Italy).
Figure 5
Figure 5. Protein synthesis in developing or hypertrophying cardiomyocytes
A, Phase contrast micrographs of fetal atrial (upper left) and ventricular (upper right) myocardium. Myofibrils are located predominantly at the subsarcolemmal region. The lower two panels illustrate by light microscopic autoradiography 3H-leucine incorporation (silver grains) indicative of ongoing protein synthesis within the atrial (left) and ventricular (right) fetal myocardium. Scale bars, 10 μm. B, Electron microscopic autoradiographs of developing fetal ventricular cardiomyocytes. Silver grains (3H-leucine) are located over contractile filaments and mitochondria, and are frequently associated with the periphery of the cells. Scale bars, 100 nm. C, Autoradiographs of transverse sections of LV myocardium after sham-operation (upper panel) or following constriction of the abdominal aorta (lower panel). The number of silver grains (3H-leucine) per high power field is 43% higher in the hypertrophied heart. Scale bars, 10 μm. Adapted from references 75 (panels A and B) and 76 (panel C).
Figure 6
Figure 6. Stem cell homing and myocardial regeneration
A, Detection of host male cells in human female hearts transplanted in male recipients. B, Number of BMPCs present in the recipient infarcted mouse myocardium 48 hours after BMPC injection. C, The fraction of CD45-positive BMPCs decreases from 12 to 48 hours following cell implantation. Results are mean±SD. *P<0.05 vs. 12 h; **P<0.05 vs. 24–36 h. Adapted from reference 88.
Figure 7
Figure 7. Intracellular Ca2+ in c-kit-positive human cardiac progenitor cells (hCPCs)
A through H, hCPCs loaded with the Ca2+ sensitive dye Fluo-3 (Fluo, green) (A) were monitored for intracellular Ca2+ oscillations and subsequently fixed and stained (B) with DAPI (blue) and c-kit antibody (red). The c-kit receptor was detected in cells (arrows) experiencing Ca2+ oscillations (C through E and F through H). Scale bars: 40 μm. I, Cytosolic Ca2+ level in a single hCPC in Tyrode solution showing a single Ca2+ elevation over a period of 33 min. J, Intracellular Ca2+ in a single hCPC exposed to the mitogen IGF-1. K, Frequency of Ca2+ oscillations in hCPCs at baseline (Tyrode solution) and following exposure to IGF-1. *P<0.05 versus Tyrode. L, Proliferation of hCPCs in the presence of IGF-1 alone or in combination with the Ca2+ oscillation inhibitors 2-APB or U-73122. *P<0.05 vs. Ctrl, ** P<0.05 vs. IGF-1. Adopted from reference 210. M, Ca2+ oscillations of c-kit-positive fetal mouse CPCs at baseline (Ctrl) and after downregulation of IP3 receptor type-2 by sh-RNA (sh-RNA-IP3-R2). N, The percentage of CPCs displaying Ca2+ oscillations in Tyrode or following exposure to ATP is attenuated in sh-RNA-IP3-R2 (sh-RNA). *,†P<0.05 vs. Ctrl and ATP alone, respectively. O, ATP-induced Ca2+ oscillations in CPCs favor cell replication. This effect is abrogated with reduced expression of IP3 receptor type-2 by sh-RNA. *,†P<0.05 vs. Ctrl and ATP alone, respectively. Baseline (Base): CSCs infected with control vector. P, Symmetric (left) and asymmetric (right) division of fetal CPCs determined by the localization of the cell fate protein α-adaptin (blue). c-kit, green; chromosomes: PI, red. Q, Reduced IP3 receptor expression inhibits asymmetric cell division. *,†P<0.05 vs. symmetric division (S) and Ctrl, respectively. Asymmetric division (A). Adapted from references 151 (panels A through L) and 79 (panels M through Q).

Similar articles

Cited by

References

    1. Anversa P, Kajstura J. Ventricular myocytes are not terminally differentiated in the adult mammalian heart. Circ Res. 1998;83:1–1. - PubMed
    1. Soonpaa MH, Field LJ. Survey of studies examining mammalian cardiomyocyte DNA synthesis. Circ Res. 1998;83:15–15. - PubMed
    1. Laflamme MA, Murry CE. Heart regeneration. Nature. 2011;473:326–326. - PMC - PubMed
    1. Braun T, Martire A. Cardiac stem cells: paradigm shift or broken promise? A view from developmental biology. Trends Biotechnol. 2007;25:441–441. - PubMed
    1. Yi BA, Wernet O, Chien KR. Pregenerative medicine: developmental paradigms in the biology of cardiovascular regeneration. J Clin Invest. 2010;120:20–20. - PMC - PubMed

Publication types