. 2015 Mar;89(5):2931-43.
doi: 10.1128/JVI.03398-14. Epub 2014 Dec 31.

Ebola virus and severe acute respiratory syndrome coronavirus display late cell entry kinetics: evidence that transport to NPC1+ endolysosomes is a rate-defining step

Affiliations

Ebola virus and severe acute respiratory syndrome coronavirus display late cell entry kinetics: evidence that transport to NPC1+ endolysosomes is a rate-defining step

Rebecca M Mingo et al. J Virol. 2015 Mar.

Abstract

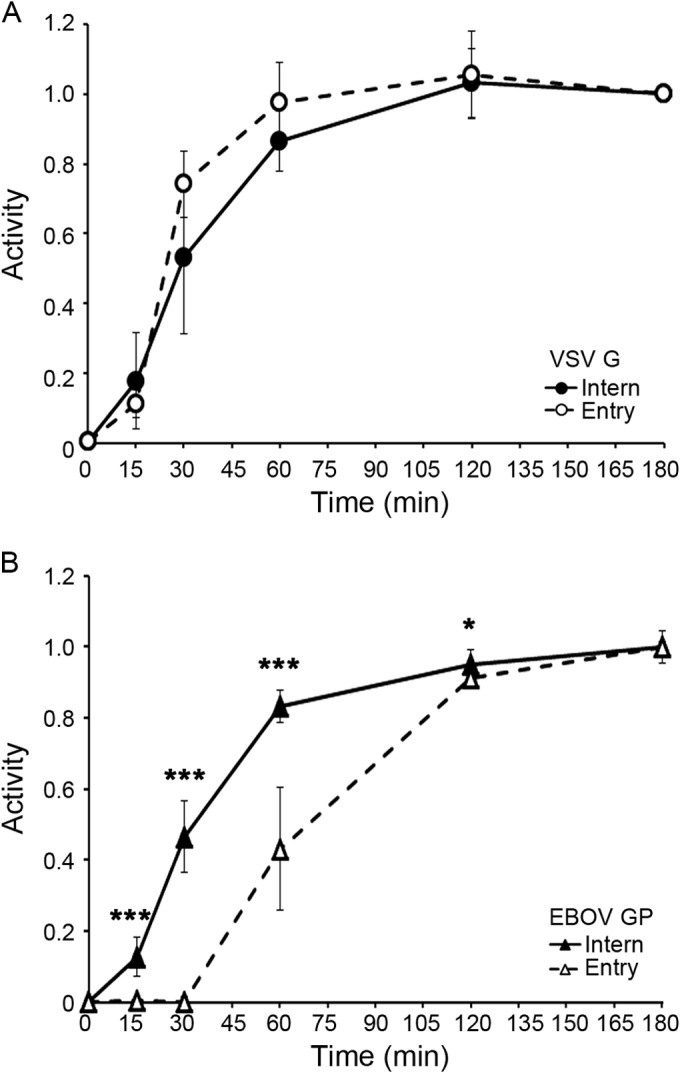
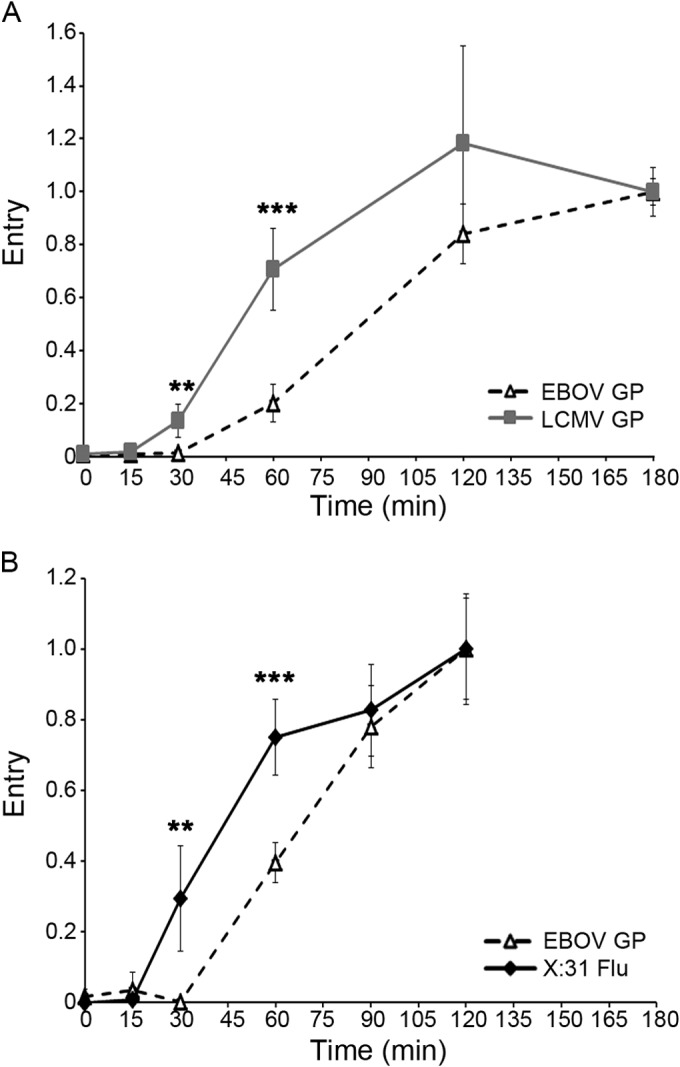
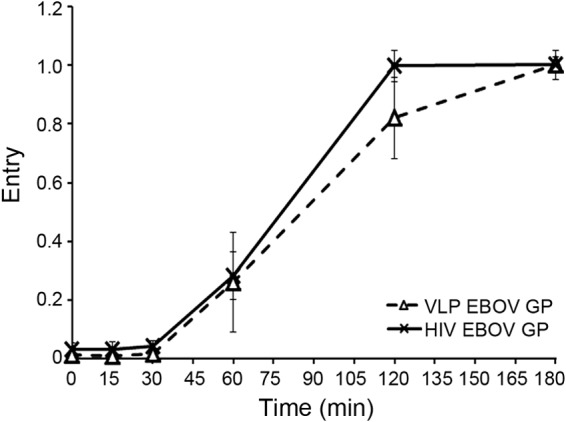
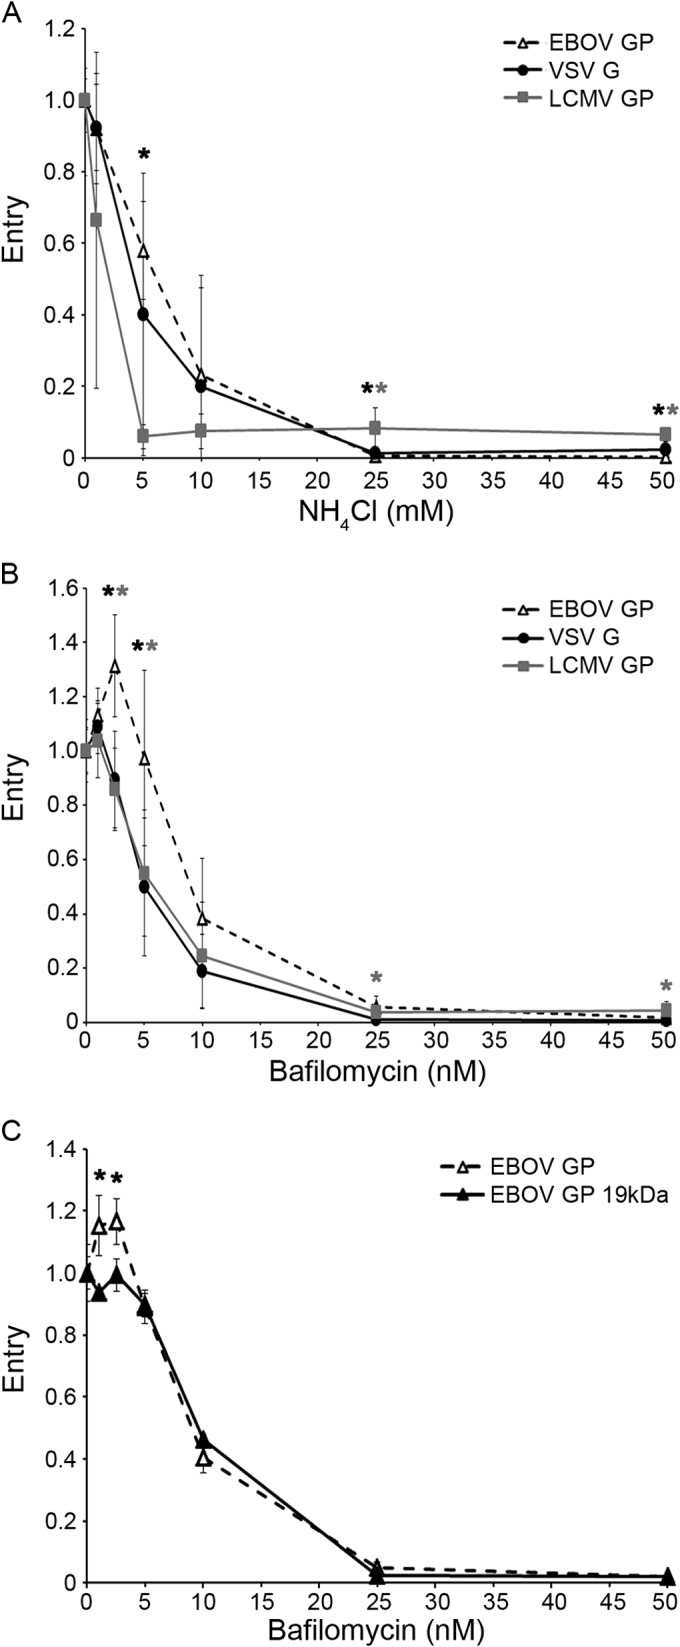
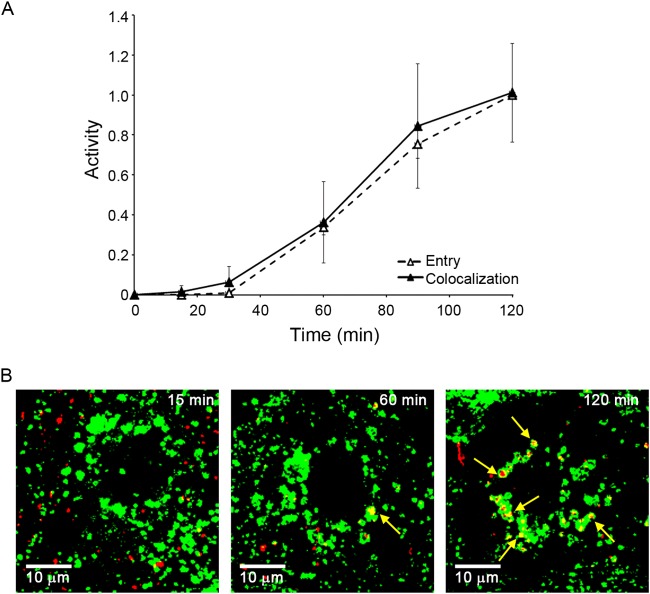
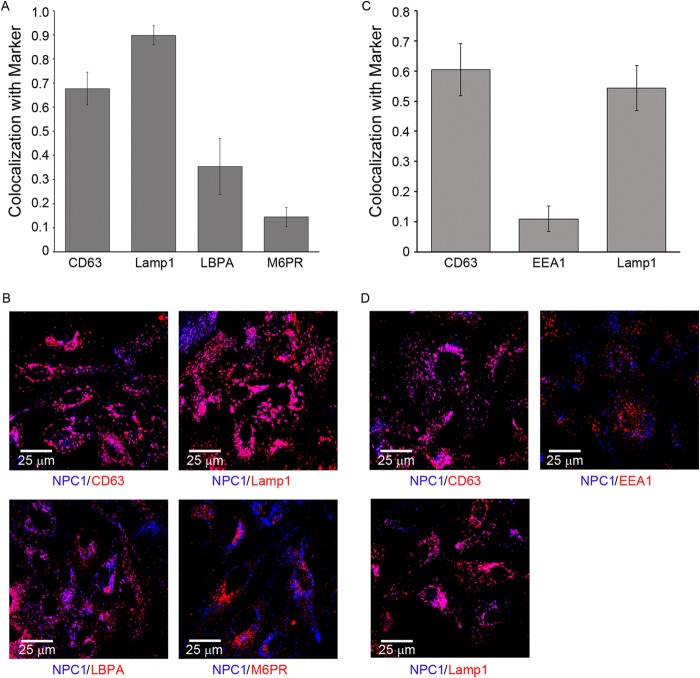
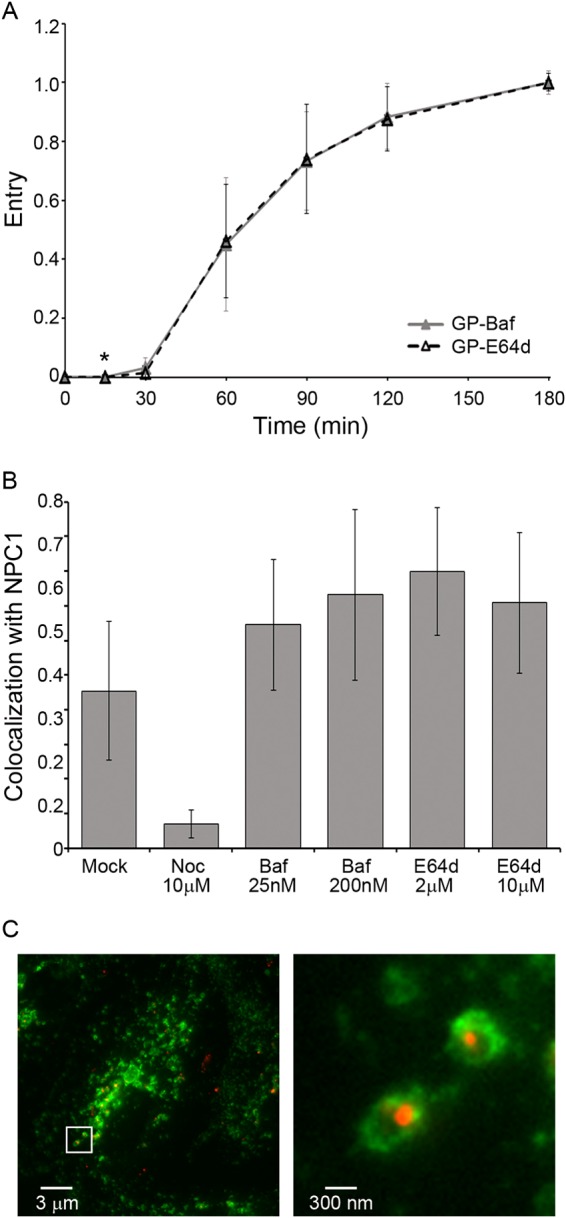
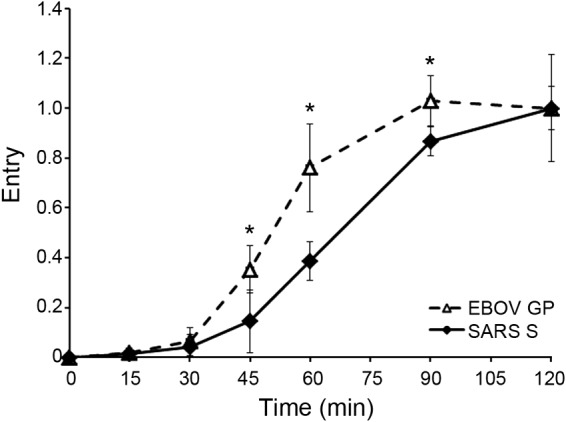
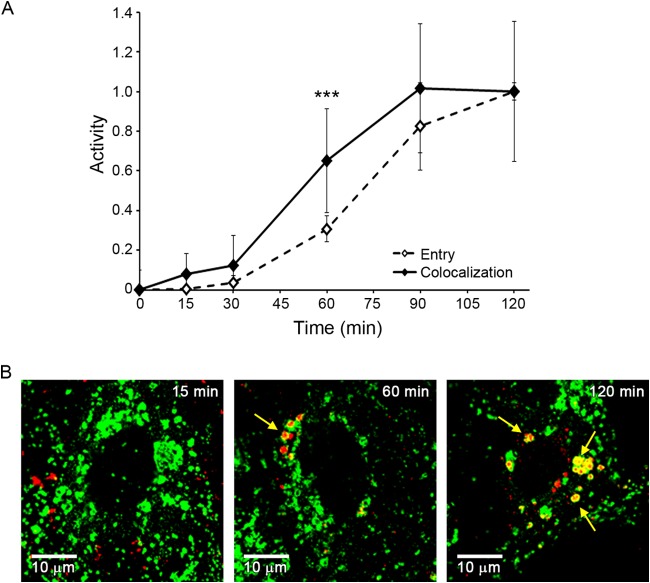
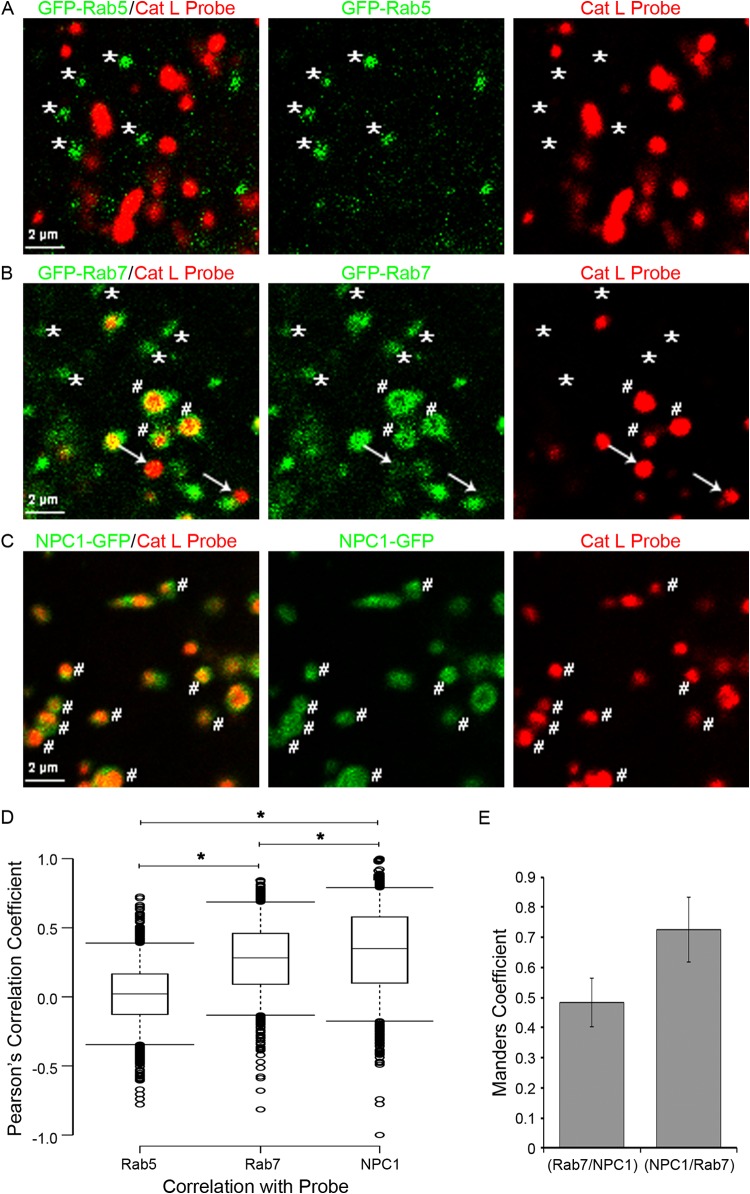
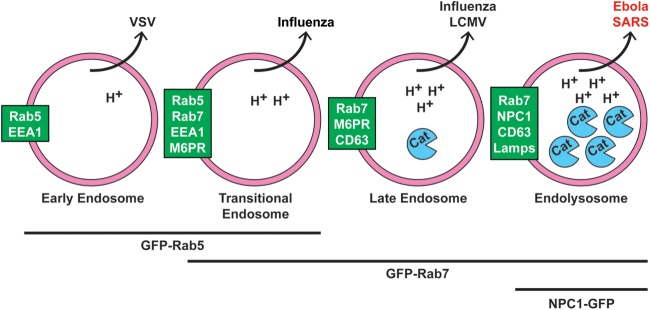
Ebola virus (EBOV) causes hemorrhagic fevers with high mortality rates. During cellular entry, the virus is internalized by macropinocytosis and trafficked through endosomes until fusion between the viral and an endosomal membrane is triggered, releasing the RNA genome into the cytoplasm. We found that while macropinocytotic uptake of filamentous EBOV viruslike particles (VLPs) expressing the EBOV glycoprotein (GP) occurs relatively quickly, VLPs only begin to enter the cytoplasm after a 30-min lag, considerably later than particles bearing the influenza hemagglutinin or GP from lymphocytic choriomeningitis virus, which enter through late endosomes (LE). For EBOV, the long lag is not due to the large size or unusual shape of EBOV filaments, the need to prime EBOV GP to the 19-kDa receptor-binding species, or a need for unusually low endosomal pH. In contrast, since we observed that EBOV entry occurs upon arrival in Niemann-Pick C1 (NPC1)-positive endolysosomes (LE/Lys), we propose that trafficking to LE/Lys is a key rate-defining step. Additional experiments revealed, unexpectedly, that severe acute respiratory syndrome (SARS) S-mediated entry also begins only after a 30-min lag. Furthermore, although SARS does not require NPC1 for entry, SARS entry also begins after colocalization with NPC1. Since the only endosomal requirement for SARS entry is cathepsin L activity, we tested and provide evidence that NPC1(+) LE/Lys have higher cathepsin L activity than LE, with no detectable activity in earlier endosomes. Our findings suggest that both EBOV and SARS traffic deep into the endocytic pathway for entry and that they do so to access higher cathepsin activity.

Importance: Ebola virus is a hemorrhagic fever virus that causes high fatality rates when it spreads from zoonotic vectors into the human population. Infection by severe acute respiratory syndrome coronavirus (SARS-CoV) causes severe respiratory distress in infected patients. A devastating outbreak of EBOV occurred in West Africa in 2014, and there was a significant outbreak of SARS in 2003. No effective vaccine or treatment has yet been approved for either virus. We present evidence that both viruses traffic late into the endocytic pathway, to NPC1(+) LE/Lys, in order to enter host cells, and that they do so to access high levels of cathepsin activity, which both viruses use in their fusion-triggering mechanisms. This unexpected similarity suggests an unexplored vulnerability, trafficking to NPC1(+) LE/Lys, as a therapeutic target for SARS and EBOV.


Figures

FIG 1
FIG 1
EBOV VLPs are internalized quickly but begin to enter the cytoplasm only after a 30-min lag. VLPs bearing either VSV G (A) or EBOV GP (B) were bound to the surface of BSC-1 cells at 4°C. After being washed, the cells were warmed to 37°C and assayed at the indicated times for internalization from the cell surface (closed symbols, solid lines) and cytoplasmic entry (open symbols, dashed lines) as described in Materials and Methods. Data points (normalized to values at 180 min) are averages from five samples from two experiments (A) and eight samples from three experiments (B); error bars indicate standard deviations (SD). Asterisks in panel B indicate statistical differences between values for EBOV internalization and entry (*, P < 0.05; *** P < 0.0005). Similar results were obtained in 293AD and SNB19 cells (not shown).
FIG 2
FIG 2
EBOV GP VLPs begin to enter the cytoplasm later than LCMV and influenza particles. (A) VLPs bearing either LCMV GP (squares, gray line) or EBOV GP (open triangles, dashed line) were bound to BSC-1 cells and assayed for cytoplasmic entry as described for Fig. 1. Each data point is the average from six samples (from three experiments performed in duplicate). Similar results were observed in experiments comparing LCMV GP and EBOV GPΔ-mediated entry into BSC-1 cells and LCMV GP and EBOV GP-mediated entry into SNB19 cells (not shown). (B) X:31 influenza virus particles (diamonds, solid line) or EBOV GP VLPs (triangles, dashed line) were bound to BSC-1 cells at 4°C. Cells were then warmed and processed and analyzed for cytoplasmic entry of EBOV GP VLPs as described for panel A. Entry of X:31 influenza virus was monitored as described in Materials and Methods. Each data point is the average from six samples (normalized to the values at 120 min) (from two experiments performed in triplicate). Error bars indicate SD. Asterisks indicate statistical significance between the extent of entry for EBOV GP versus LCMV GP (A) or EBOV GP versus influenza (B) particles: **, P < 0.005; ***, P < 0.0005. Both the lag before the onset of and the half-life for entry of EBOV GP VLPs are independent of the final extent of entry observed in individual experiments (not shown).
FIG 3
FIG 3
EBOV GP begins to mediate cytoplasmic entry after a 30-min lag whether on a filamentous VLP or a spherical retroviral pseudovirion. VLPs (triangles, dashed line) or HIV pseudovirions (x, solid line) bearing EBOV GP were bound to BSC-1 cells at 4°C, warmed to 37°C, and analyzed for cytoplasmic entry as described for Fig. 1. Each data point is the average from four samples (from two experiments performed in duplicate). Error bars indicate SD. None of the data points are statistically different at P values of <0.05.
FIG 4
FIG 4
EBOV GP VLPs begin to enter the cytoplasm after a 30-min lag whether they bear full-length, Δmucin, or 19-kDa EBOV GP. VLPs bearing the indicated form of EBOV GP (full length, open black triangles, dashed black line; GPΔ, solid gray triangles, solid gray line; mock-cleaved GPΔ, open gray triangles, dashed gray line; 19-kDa GP, solid black triangle, solid black line) were bound to the surface of BSC (A), 293AD (B), or SNB19 (C) cells at 4°C, warmed, and assayed for cytoplasmic entry as described for Fig. 1. Data points in each panel are the averages from duplicate samples, and error bars indicate SD. Data for panel 4C are from Fig. 2.5B from a Ph.D. thesis (24). None of the comparative data points (for different forms of GP) are statistically different at P values of <0.05.
FIG 5
FIG 5
EBOV GP does not require unusually low pH to mediate cytoplasmic entry. BSC-1 cells were pretreated for 15 min with the indicated concentration of either NH4Cl (A) or bafilomycin (B, C). VLPs bearing EBOV GP (open triangles, dashed line), LCMV GP (squares, gray line), VSV G (circles, solid black line), or 19-kDa EBOV GP (black triangles, black line) were then bound, and the cells were processed and analyzed for cytoplasmic entry as described for Fig. 1, except that the indicated concentration of the indicated inhibitor was present for all steps. Each data point in panels A and B is the average from six samples (from three experiments performed in duplicate). Each data point in panel C is the average from three samples from one experiment. In all panels, error bars indicate SD. Asterisks in panels A and B indicate that the value for EBOV GP is higher than that for LCMV GP (black) or VSV G (gray) at P values of <0.05 (*) or <0.005 (**). Note that a higher value indicates, if anything, lower sensitivity to the lysosomotropic agent. Asterisks in panel C indicate a higher value for EBOV GP than for the 19-kDa GP (*, P < 0.05).
FIG 6
FIG 6
EBOV VLPs begin to enter the cytoplasm soon after arrival in an NPC1+ endosome. (A) EBOV GP VLPs were bound to parallel sets of BSC-1 cells at 4°C and, after being washed, incubated at 37°C. At the indicated time, cells were analyzed for cytoplasmic entry (open triangles, dashed line) as described for Fig. 1 and for colocalization with NPC1 (solid triangles, solid line) as described in Materials and Methods. Data are the averages from six experiments. In each experiment, entry was monitored in duplicate samples and NPC1 colocalization was analyzed from 20 to 30 microscope fields. Colocalization is presented as Manders coefficients normalized to the average Manders coefficient at the 120-min time point (0.45 ± 0.12). We did not extend the analysis to 180 min, as across all experiments entry at 120 min was 94.5% of that seen at 180 min (i.e., virtually maximal). Error bars indicate SD. There was no statistically significant difference between the extent of colocalization and the extent of entry at any of the time points. (B) Representative micrographs from 15-, 60-, and 120-min time points. Red, VLPs (Cherry-VP40); green, NPC1 (antibody staining). Yellow arrows indicate areas of overlap.
FIG 7
FIG 7
Characterization of NPC1+ endosomes in BSC-1 cells. BSC-1 cells were fixed, permeabilized, and stained with a rabbit monoclonal antibody against NPC1 as well as mouse monoclonal antibodies versus CD63, Lamp1, LBPA, M6PR, or EEA1, as indicated. They were then stained with corresponding Alexa Fluor 647 anti-rabbit or anti-mouse Alexa Fluor 546 secondary antibodies, as appropriate, and observed by confocal microscopy. For each sample, 10 random fields were analyzed for overlap between NPC1 and the indicated marker. (A, C) Manders colocalization coefficients. Error bars represent SD. Representative images (B, D) are shown below each graph. The data are from two separate experiments shown on the left (A, B) and right (C, D). In another experiment, high colocalization was also seen between Lamp2 and NPC1 (not shown).
FIG 8
FIG 8
EBOV GP VLPs remain sensitive to E64d within NPC1+ endosomes. (A) EBOV GP VLPs overcome their sensitivity to E64d and bafilomycin with the same kinetics. EBOV GP VLPs were bound to BSC-1 cells at 4°C and then warmed to 37°C. At the indicated times, cells were treated with bafilomycin (200 nM) or E64d (2 μM). Cells were then processed for EBOV GP VLP cytoplasmic entry as described for Fig. 1. Each data point is the average from eight samples (from three experiments; two performed in triplicate and one performed in duplicate). Only one point showed a statistical difference: *, P < 0.05. The same result was obtained in 293AD cells (not shown). (B) Neither E64d nor bafilomycin prevents the arrival of EBOV GP VLP in NPC1+ endosomes: BSC-1 cells were pretreated for 15 min with dimethyl sulfoxide (DMSO; mock) or the indicated concentration of inhibitor (Noc, nocodazole; Baf, bafilomycin; E64d). Samples taken 120 min post-warm-up to 37°C were then analyzed for VLP colocalization with NPC1 as described for Fig. 6 (20 fields/sample; error bars represent SD). (C) EBOV GP VLPs are found within the lumen of NPC1+ endosomes in the presence of E64d. Samples from the 120-min time point (2 μM E64d) were processed as described for panel B and observed with a Plan Apo A/1.40 60× oil objective on a Nikon Eclipse TE2000-E fluorescence microscope. Left, representative image; right, ×10 zoom of white box. Red, EBOV GP VLP (mCherry-VP40); green, NPC1.
FIG 9
FIG 9
Entry mediated by both SARS CoV S and EBOV GP begins after a 30-min lag. HIV pseudovirions bearing either SARS S (solid diamonds, solid line) or EBOV GP (open triangles, dashed line) were processed and analyzed for cytoplasmic entry (quenched with 5 μM E64d) as described for Fig. 1. Each data point is the average from four samples (from two experiments performed in duplicate). Error bars indicate SD, and asterisks indicate statistically significant differences (*, P < 0.05) between EBOV GP and SARS S at the indicated time point.
FIG 10
FIG 10
SARS S pseudovirions begin to enter the cytoplasm after colocalization with NPC1. (A) SARS S pseudovirions were bound to parallel sets of BSC-1 cells at 4°C and then incubated at 37°C to allow internalization and entry. At the indicated times, cells were analyzed for cytoplasmic entry (open diamonds, dashed line) as described for Fig. 3 or colocalization with NPC1 (solid diamonds, solid line) as described in Materials and Methods. Entry data are the averages from five samples (from two experiments). NPC1 colocalization was analyzed from 55 microscope fields (from two experiments) and presented as Manders coefficients normalized to the average Manders coefficient at 120 min (0.43 ± 0.11). Error bars indicate SD. ***, P < 0.0005, for the 60-min time point. (B) Representative images from the 15-min, 60-min, and 120-min time points are shown. Red, staining for HIV p24; green, staining for NPC1. Yellow arrows indicate areas of overlap.
FIG 11
FIG 11
Colocalization of cat L activity with Rab5+, Rab7+, and NPC1+ endosomes. BSC-1 cells were transfected to express GFP-Rab5, GFP-Rab7, or NPC1-GFP, incubated with a cat L activity probe, and analyzed by live-cell microscopy on a spinning disk confocal microscope as described in Materials and Methods. Shown are images from the respective movies at 2 to 3 min after the addition of substrate for cat L activity (red) and endosomes (green) marked by GFP-Rab5 (A), GFP-Rab7 (B), or NPC1-GFP (C). (D) Box plots showing the Pearson correlation coefficients (calculated as described in Materials and Methods) between GFP-Rab5 (n = 1,332), GFP-Rab7 (n = 1,238), or NPC1-GFP (n = 1,314) and cat L activity. Asterisk denotes statistical significance (P ≤ 0.0001). Medians are represented by center lines and the 25th and 75th percentiles by upper and lower box boundaries. Whiskers cover the 5th and 95th percentiles, and circles show outliers. (E) Manders values representing the percent overlap of GFP-Rab7 with endogenous NPC1 and endogenous NPC1 and GFP-Rab7. Averaged percent colocalization was calculated after analyzing 33 cells. Error bars represent SD.
FIG 12
FIG 12
Working model for cellular sites of EBOV and SARS CoV entry. We propose that Ebola and SARS enter the cytoplasm later than other “late-penetrating viruses” (e.g., influenza and LCMV), through NPC1+ endolysosomes (LE/Lys). We further propose that they do so to access high levels of endosomal cathepsins (and, for EBOV, to bind to NPC1). Text in green boxes indicates markers of the respective organelles (pink circles). Viruses known to exit each organelle are indicated above. While one study showed that influenza enters through transitional endosomes (40), others refer to influenza and LCMV as entering through LE (15, 26). H+ indicates protons, and Cat indicates cathepsins. Lines and text below the organelles indicate GFP-tagged markers used in Fig. 11 and Movies S1 to S3 in the supplemental material.

References

    1. Feldmann H, Geisbert TW. 2011. Ebola haemorrhagic fever. Lancet 377:849–862. doi:10.1016/S0140-6736(10)60667-8. - DOI - PMC - PubMed
    1. Hartman AL, Towner JS, Nichol ST. 2010. Ebola and Marburg hemorrhagic fever. Clin Lab Med 30:161–177. doi:10.1016/j.cll.2009.12.001. - DOI - PubMed
    1. Gire SK, Goba A, Andersen KG, Sealfon RSG, Park DJ, Kanneh L, Jalloh S, Momoh M, Fullah M, Dudas G, Wohl S, Moses LM, Yozwiak NL, Winnicki S, Matranga CB, Malboeuf CM, Qu J, Gladden AD, Schaffner SF, Yang X, Jiang PP, Nekoui M, Colubri A, Coomber MR, Fonnie M, Moigboi A, Gbakie M, Kamara FK, Tucker V, Konuwa E, Saffa S, Sellu J, Jalloh AA, Kovoma A, Koninga J, Mustapha I, Kargbo K, Foday M, Yillah M, Kanneh F, Robert W, Massally JLB, Chapman SB, Bochicchio J, Murphy C, Nusbaum C, Young S, Birren BW, Grant DS, Scheiffelin JS, Lander ES, Happi C, Gevao SM, Gnirke A, Rambaut A, Garry RF, Khan SH, Sabeti PC. 2014. Genomic surveillance elucidates Ebola virus origin and transmission during the 2014 outbreak. Science 345:1369–1372. doi:10.1126/science.1259657. - DOI - PMC - PubMed
    1. Chandran K. 2012. Filovirus entry into cells—new insights. Curr Opin Virol 2:206–214. doi:10.1016/j.coviro.2012.02.015. - DOI - PMC - PubMed
    1. Hofmann-Winkler H, Kaup F, Pöhlmann S. 2012. Host cell factors in filovirus entry: novel players, new insights. Viruses 4:3336–3362. doi:10.3390/v4123336. - DOI - PMC - PubMed

Publication types