. 2015 Mar;89(6):3093-111.
doi: 10.1128/JVI.02507-14. Epub 2014 Dec 31.

Transcriptome analysis of Kaposi's sarcoma-associated herpesvirus during de novo primary infection of human B and endothelial cells

Affiliations

Transcriptome analysis of Kaposi's sarcoma-associated herpesvirus during de novo primary infection of human B and endothelial cells

Pravinkumar Purushothaman et al. J Virol. 2015 Mar.

Abstract

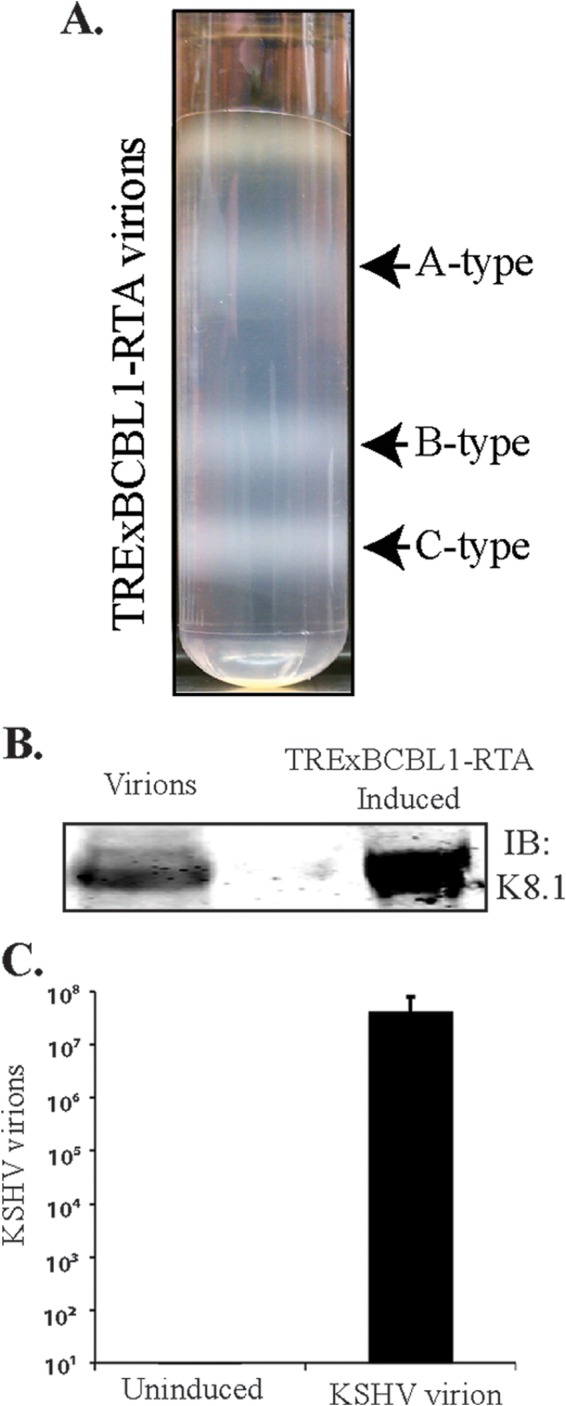
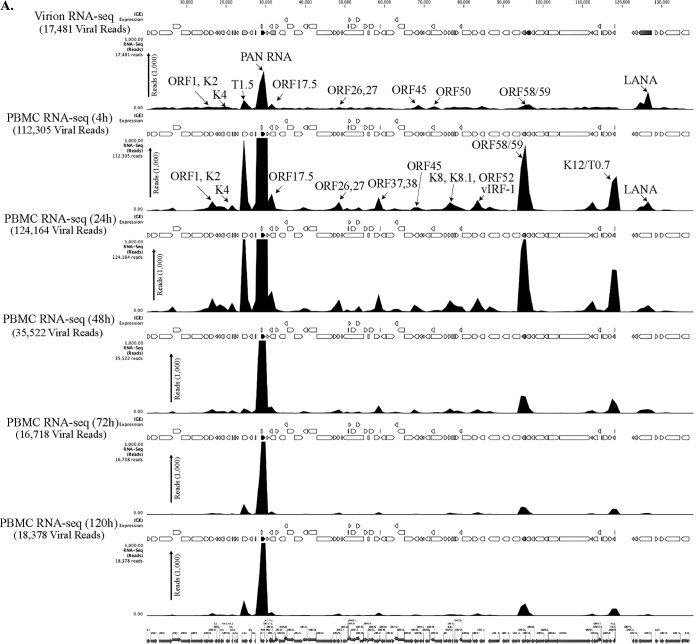
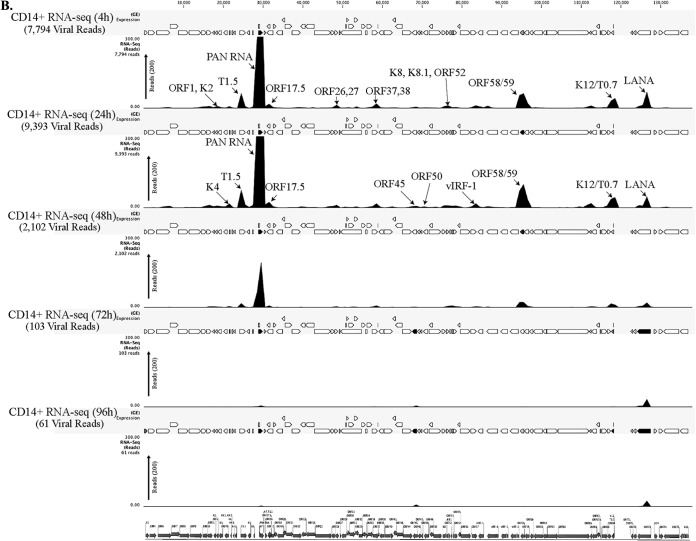
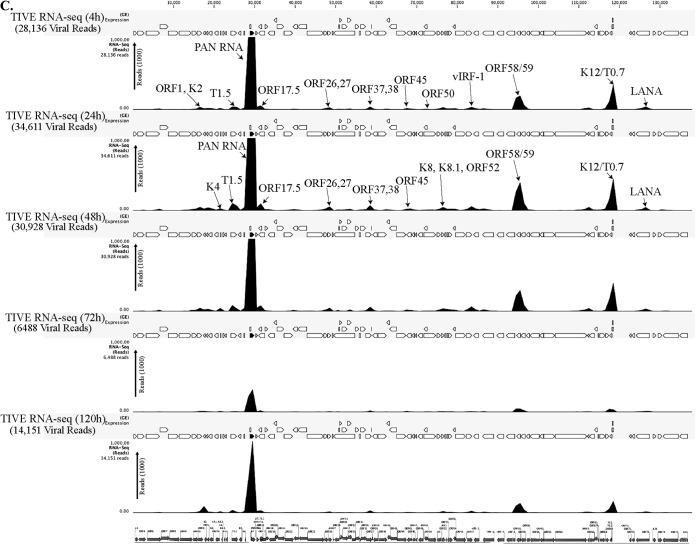
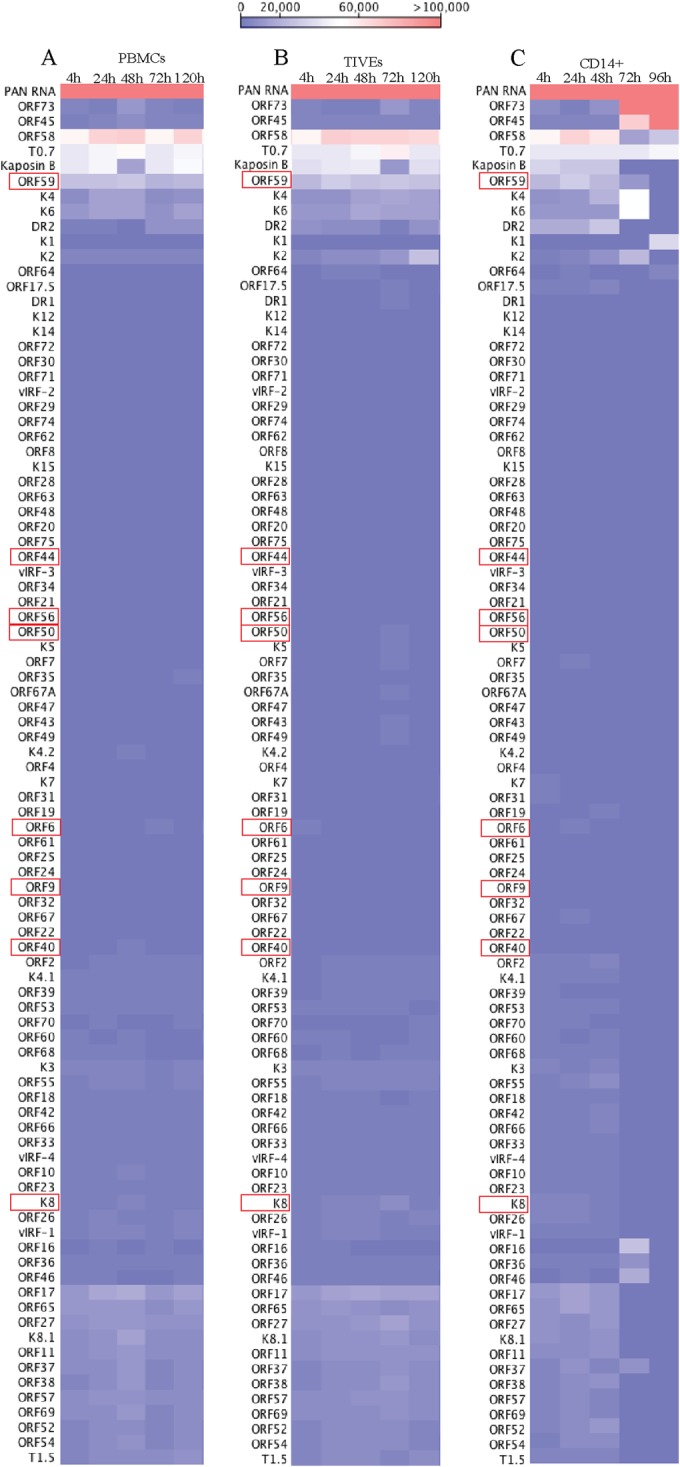
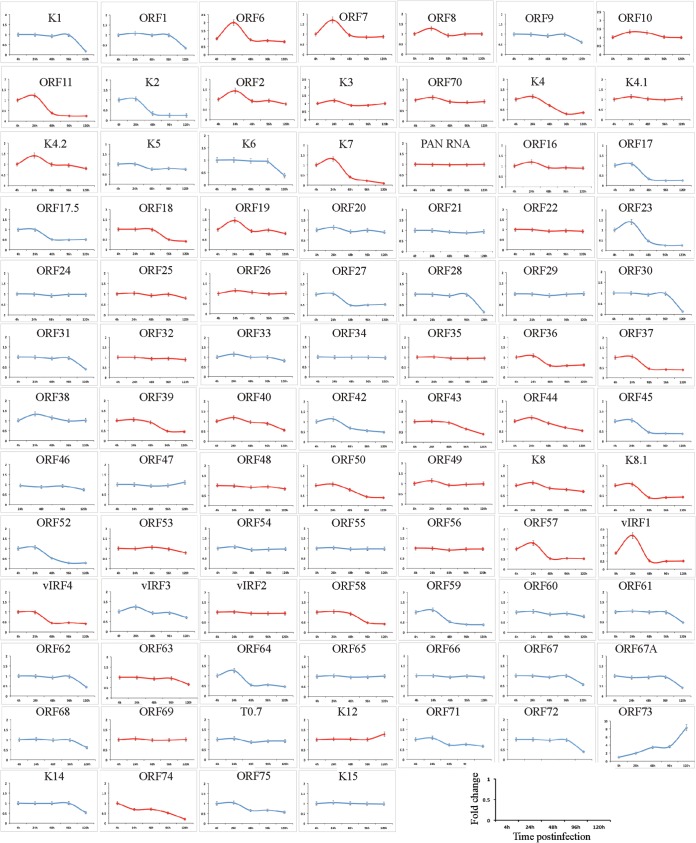
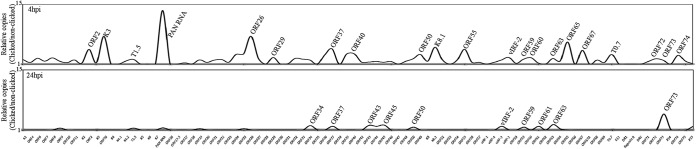
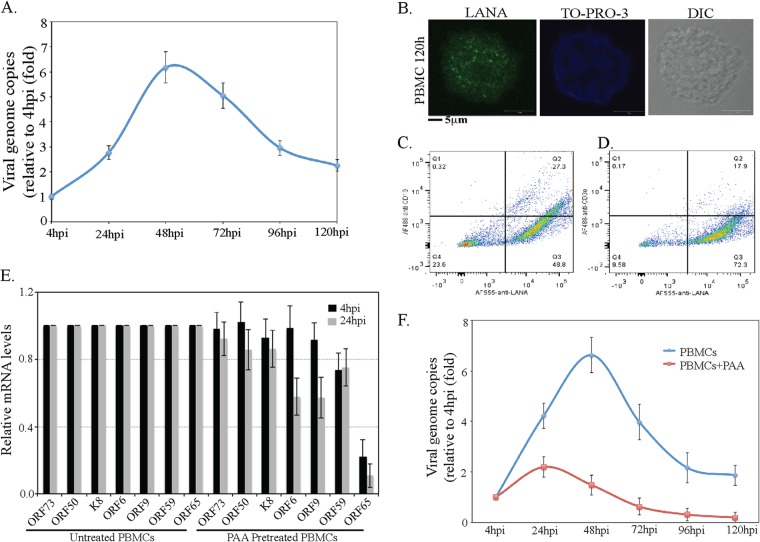
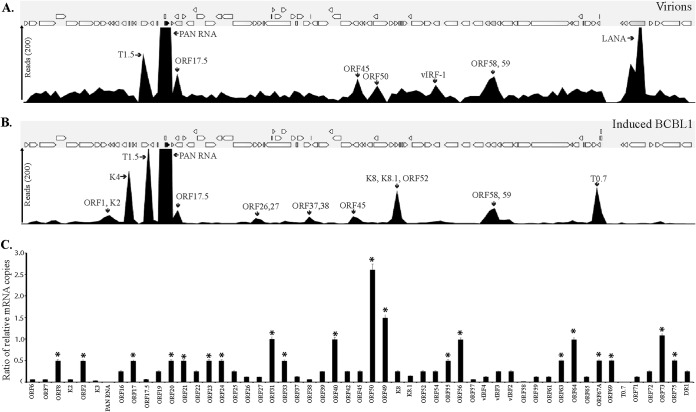
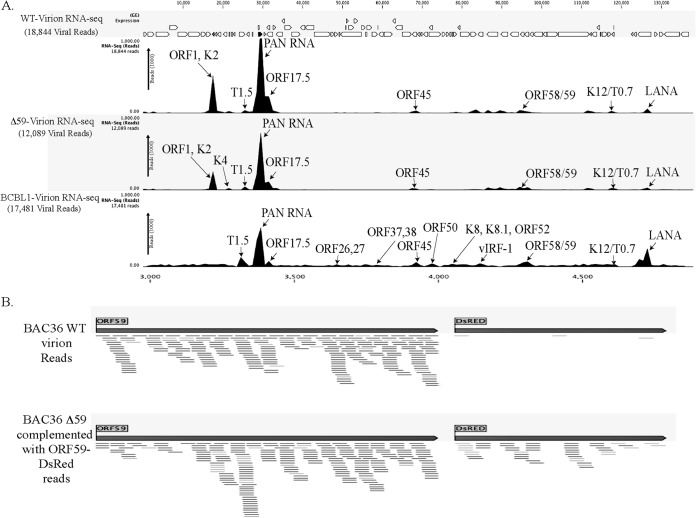
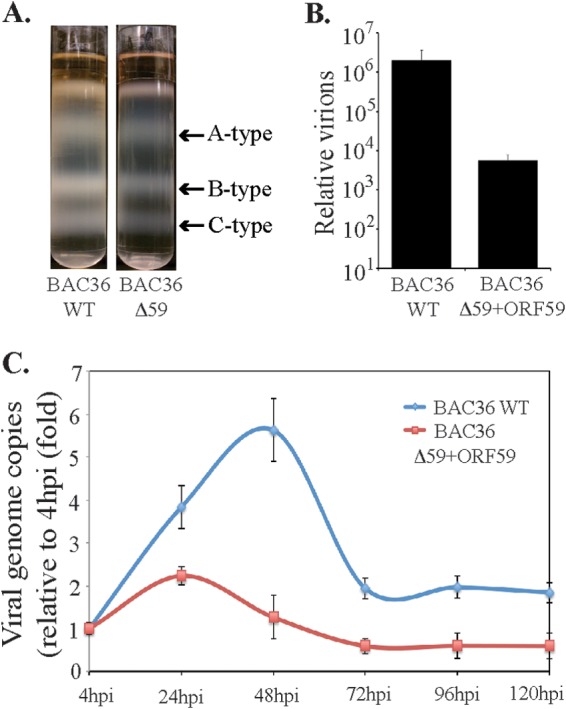
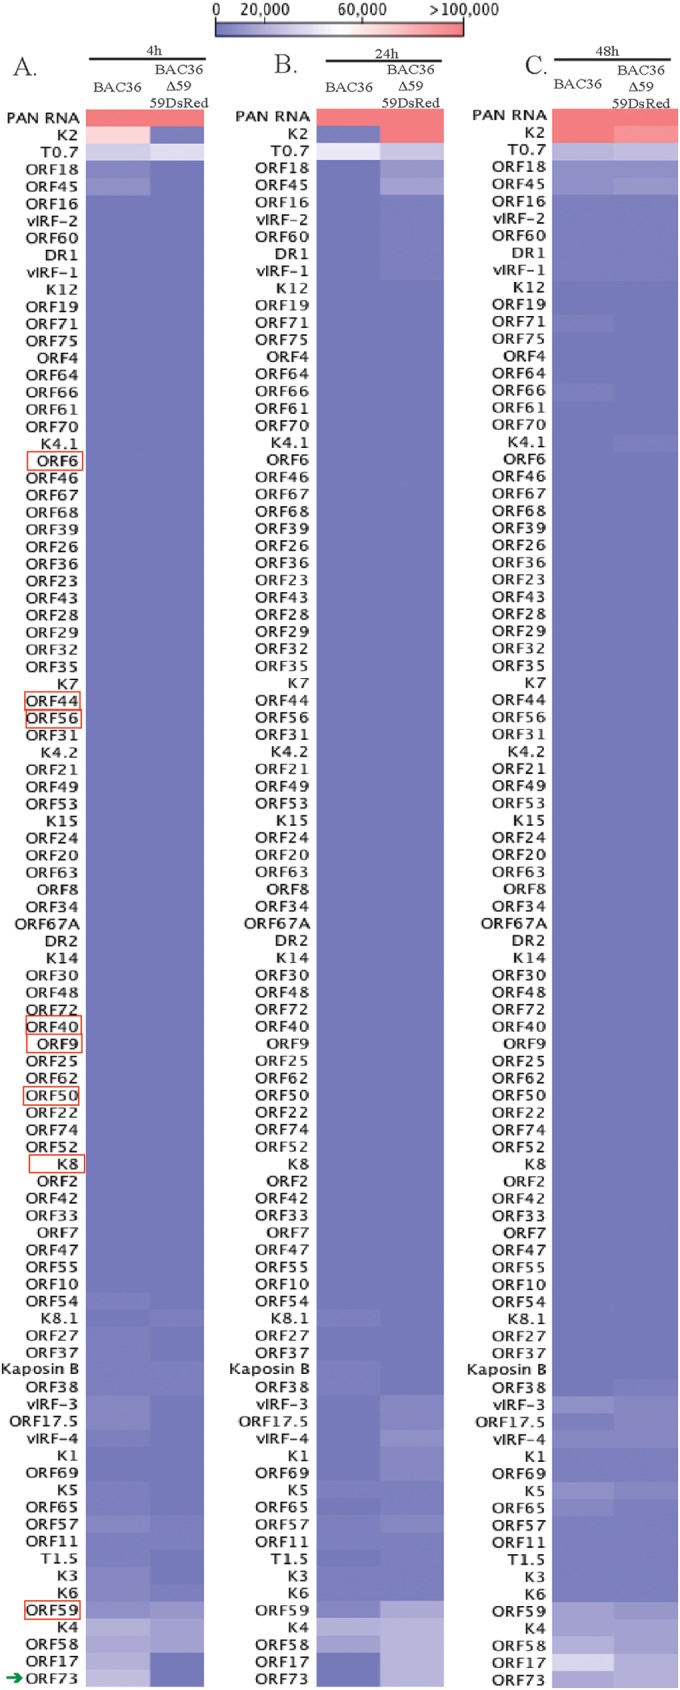
Kaposi's sarcoma-associated herpesvirus (KSHV) infects many target cells (e.g., endothelial, epithelial, and B cells, keratinocytes, and monocytes) to establish lifelong latent infections. Viral latent-protein expression is critical in inducing and maintaining KSHV latency. Infected cells are programmed to retain the incoming viral genomes during primary infection. Immediately after infection, KSHV transcribes many lytic genes that modulate various cellular pathways to establish successful infection. Analysis of the virion particle showed that the virions contain viral mRNAs, microRNAs, and other noncoding RNAs that are transduced into the target cells during infection, but their biological functions are largely unknown. We performed a comprehensive analysis of the KSHV virion packaged transcripts and the profiles of viral genes transcribed after de novo infections of various cell types (human peripheral blood mononuclear cells [PBMCs], CD14(+) monocytes, and telomerase-immortalized vascular endothelial [TIVE] cells), from viral entry until latency establishment. A next-generation sequence analysis of the total transcriptome showed that several viral RNAs (polyadenylated nuclear RNA, open reading frame 58 [ORF58], ORF59, T0.7, and ORF17) were abundantly present in the KSHV virions and effectively transduced into the target cells. Analysis of the transcription profiles of each viral gene showed specific expression patterns in different cell lines, with the majority of the genes, other than latent genes, silencing after 24 h postinfection. We differentiated the actively transcribing genes from the virion-transduced transcripts using a nascent RNA capture approach (Click-iT chemistry), which identified transcription of a number of viral genes during primary infection. Treating the infected cells with phosphonoacetic acid (PAA) to block the activity of viral DNA polymerase confirmed the involvement of lytic DNA replication during primary infection. To further understand the role of DNA replication during primary infection, we performed de novo PBMC infections with a recombinant ORF59-deleted KSHV virus, which showed significantly reduced numbers of viral copies in the latently infected cells. In summary, the transduced KSHV RNAs as well as the actively transcribed genes control critical processes of early infection to establish KSHV latency.

Importance: Kaposi's sarcoma-associated herpesvirus (KSHV) is the causative agent of multiple human malignancies in immunocompromised individuals. KSHV establishes a lifelong latency in the infected host, during which only a limited number of viral genes are expressed. However, a fraction of latently infected cells undergo spontaneous reactivation to produce virions that infect the surrounding cells. These newly infected cells are primed early to retain the incoming viral genome and induce cell growth. KSHV transcribes a variety of lytic proteins during de novo infections that modulate various cellular pathways to establish the latent infection. Interestingly, a large number of viral proteins and RNA are encapsidated in the infectious virions and transduced into the infected cells during a de novo infection. This study determined the kinetics of the viral gene expression during de novo KSHV infections and the functional role of the incoming viral transcripts in establishing latency.


Figures

FIG 1
FIG 1
Purification of KSHV virions. (A) Virions were purified from the culture supernatant of approximately 9 × 10⁸ reactivated TRExBCBL1-RTA cells by a20 to 50% sucrose gradient ultracentrifugation. The three white bands as indicated represent A-type (empty), B-type (intermediate), and C-type (mature) KSHV virus particles. (B) Western blotting of purified virions for the presence of KSHV envelope glycoprotein K8.1 by immunoblotting with anti-K8.1 antibody. Total lysate from induced TRExBCBL1-RTA cells was used as a positive control. (C) Supernatants of uninduced or induced TRExBCBL1-RTA cells were used for real-time qPCR quantification of viral genome copy using ORF73-specific primers along with ORF73 plasmid standards. Approximately 8.06 × 10⁷ copies of viral DNA representing C-type virions were detected.
FIG 2
FIG 2
(A) Transcriptome analysis of KSHV during de novo infection of human PBMCs. Total RNAs extracted from de novo-infected PBMCs harvested at 4 h, 24 h, 48 h, 72 h, and 120 h postinfection were subjected to cDNA library preparation using a TrueSeq RNA-seq library kit. The libraries were sequenced using HiSeq, and the sequences were mapped to the reference KSHV genome to determine the relative abundance of viral transcripts. Purified virions treated with micrococcal nuclease to eliminate nucleic acid contamination were subjected to total RNA extraction. RNA treated with DNase was used for sequencing after cDNA library preparation. The number of transcripts mapping to the viral genome is shown in parentheses in each panel. The peak height represents the number of reads for the indicated genes, and the predominant peaks are marked in virion RNA-seq and 4-h-postinfection samples. PAN RNA showed the highest peak in virions as well as KSHV-infected PBMCs. The bottom panel shows the locations of KSHV genes on the coordinates. (B) Transcriptome analysis of de novo-infected CD14+ cells. Total RNAs extracted from de novo-infected CD14+ cells harvested at 4 h, 24 h, 48 h, 72 h, and 96 h postinfection were subjected to cDNA library preparation using a TrueSeq RNA-seq library kit. The libraries were sequenced using HiSeq, and the sequences were mapped to the reference KSHV genome to determine the relative abundance of viral transcripts. The number of transcripts mapping to the viral genome is shown in parentheses in each panel. The peak heights representing the number of reads for the indicated genes are marked in 4-h-postinfection and 24-h-postinfection samples. PAN RNA showed the highest peak until 48 h postinfection, followed by a decline to very low levels. LANA expression progressively increased, showing establishment of latency. The bottom panel shows the locations of KSHV genes on the coordinates. (C) Transcriptome analysis of de novo-infected TIVE cells. Total RNAs extracted from de novo-infected TIVE cells harvested at 4 h, 24 h, 48 h, 72 h, and 120 h postinfection were subjected to cDNA library preparation using a TrueSeq RNA-seq library kit. The libraries were sequenced using HiSeq, and the sequences were mapped to the reference KSHV genome to determine the relative abundance of viral mRNA. The numbers of transcripts mapping to the viral genome are shown in parenthesis on each panel. The peak heights representing the number of reads for the indicated genes are marked in 4-h-postinfection and 24-h-postinfection samples. The sample from 72 h postinfection showed lower peaks because of the lower number of total reads, which were normalized by calculating the RPKM values in the heat maps. The bottom panel shows the locations of KSHV genes on the coordinates.
FIG 2
FIG 2
(A) Transcriptome analysis of KSHV during de novo infection of human PBMCs. Total RNAs extracted from de novo-infected PBMCs harvested at 4 h, 24 h, 48 h, 72 h, and 120 h postinfection were subjected to cDNA library preparation using a TrueSeq RNA-seq library kit. The libraries were sequenced using HiSeq, and the sequences were mapped to the reference KSHV genome to determine the relative abundance of viral transcripts. Purified virions treated with micrococcal nuclease to eliminate nucleic acid contamination were subjected to total RNA extraction. RNA treated with DNase was used for sequencing after cDNA library preparation. The number of transcripts mapping to the viral genome is shown in parentheses in each panel. The peak height represents the number of reads for the indicated genes, and the predominant peaks are marked in virion RNA-seq and 4-h-postinfection samples. PAN RNA showed the highest peak in virions as well as KSHV-infected PBMCs. The bottom panel shows the locations of KSHV genes on the coordinates. (B) Transcriptome analysis of de novo-infected CD14+ cells. Total RNAs extracted from de novo-infected CD14+ cells harvested at 4 h, 24 h, 48 h, 72 h, and 96 h postinfection were subjected to cDNA library preparation using a TrueSeq RNA-seq library kit. The libraries were sequenced using HiSeq, and the sequences were mapped to the reference KSHV genome to determine the relative abundance of viral transcripts. The number of transcripts mapping to the viral genome is shown in parentheses in each panel. The peak heights representing the number of reads for the indicated genes are marked in 4-h-postinfection and 24-h-postinfection samples. PAN RNA showed the highest peak until 48 h postinfection, followed by a decline to very low levels. LANA expression progressively increased, showing establishment of latency. The bottom panel shows the locations of KSHV genes on the coordinates. (C) Transcriptome analysis of de novo-infected TIVE cells. Total RNAs extracted from de novo-infected TIVE cells harvested at 4 h, 24 h, 48 h, 72 h, and 120 h postinfection were subjected to cDNA library preparation using a TrueSeq RNA-seq library kit. The libraries were sequenced using HiSeq, and the sequences were mapped to the reference KSHV genome to determine the relative abundance of viral mRNA. The numbers of transcripts mapping to the viral genome are shown in parenthesis on each panel. The peak heights representing the number of reads for the indicated genes are marked in 4-h-postinfection and 24-h-postinfection samples. The sample from 72 h postinfection showed lower peaks because of the lower number of total reads, which were normalized by calculating the RPKM values in the heat maps. The bottom panel shows the locations of KSHV genes on the coordinates.
FIG 3
FIG 3
Transcriptome analysis of KSHV in de novo-infected PBMCs, TIVE cells, and CD14+ cells. RPKM values, calculated based the number of reads for each gene, were used for analyzing relative expression of KSHV genes as heat maps. Hierarchal clustering of genes was performed using CLC Workbench 7.0. Increasing RPKM values are represented from blue to red. (A) KSHV transcriptome from de novo-infected human PBMCs. (B) KSHV transcriptome from de novo-infected human TIVE cells. (C) KSHV transcriptome from de novo-infected human CD14+ cells.
FIG 4
FIG 4
Real-time qPCR validation of de novo-infected PBMCs. Real-time qPCR analysis was performed on the cDNA prepared from total RNA harvested at 4 h, 24 h, 48 h, 96 h, and 120 h postinfection of human PBMCs. A 96-well format qPCR plate representing each of the KSHV-specific ORF primers was used for the qPCR analysis. Fold changes of individual KSHV transcripts at various time points are plotted. The lytic genes are shown in red.
FIG 5
FIG 5
Viral genes transcribed at 4 hpi and 24 hpi, identified by a nascent RNA capture approach. Human PBMCs infected with KSHV virions were incubated with EdU (alkyne) at 4 hpi and 24 hpi to label the newly transcribing RNA. Total RNA extracted from these cells was subjected to click reaction with biotin-azide (Invitrogen, Inc.). DMSO instead of biotin-azide was used in control click reactions. Newly synthesized, biotin-labeled RNA was enriched by streptavidin magnetic beads as per the manufacturer's instructions. These enriched RNAs were subjected to RNA-seq analysis by HiSeq, and the sequences were mapped to the KSHV reference genome (NC_009333) using CLC Bio Workbench 7.5. The relative numbers of copies of the newly synthesized viral RNA were determined by ratios of specific (biotin-labeled) to nonspecific (DMSO) sequence reads.
FIG 6
FIG 6
KSHV genome copies exponentially increase after infection. (A) Approximately 8 × 10⁷ human PBMCs were infected with KSHV isolated from reactivated TRExBCBL1-RTA, with a multiplicity of infection (MOI) of 10. De novo-infected PBMCs were harvested at 4 h, 24 h, 48 h, 72 h, 96 h, and 120 h postinfection, followed by extraction of total DNA using a modified Hirt lysis method. This DNA was used to analyze the genome copy number by real-time qPCR using ORF73-specific primers and ORF73 plasmid as a standard. (B) Indirect immunofluorescence assay (IFA) for LANA on de novo-infected PBMCs. KSHV-infected PBMCs at 120 h postinfection were subjected to IFA with rat anti-LANA antibody followed by detection with Alexa Fluor 488 secondary antibody. Nuclear stain TO-PRO-3 was used for staining the nuclei. LANA is shown in green, and nuclear stain TO-PRO 3 is shown in blue. (C and D) Flow cytometry analysis of de novo-infected PBMCs. KSHV-infected PBMCs at 120 h postinfection were subjected to flow cytometry analysis to detect the percentages of B and T lymphocytes infected with KSHV. Mouse anti-CD19 was used for the detection of B lymphocytes, and mouse anti-CD3 was used for the detection of T lymphocytes. Rat anti-LANA was used to gate KSHV-positive cells. Data were acquired on a FACSCalibur equipped with CellQuest Pro software and analyzed using FlowJo software. (E) PAA treatment reduces the expression of late genes. Untreated or PAA-pretreated human PBMCs were infected with KSHV virions (MOI of 10) for 4 h or 24 h. Total RNAs extracted at 4 hpi and 24 hpi were subjected to detection of selected viral transcripts by real-time qPCR, which showed significant reduction in ORF65 (late gene) expression with PAA treatment. (F) PAA treatment reduces viral genome copies in KSHV-infected human PBMCs. Untreated or PAA-treated human PBMCs infected with KSHV virions (MOI of 10) were subjected to genome copy analysis. Viral genome copies at different time postinfection were determined relative to the copies at 4 hpi.
FIG 7
FIG 7
RNA-seq and real-time qPCR validation of the KSHV virion transcriptome. (A) RNA-seq analysis of virions purified from induced TRExBCBL1-RTA. (B) RNA-seq analysis of induced TRExBCBL1-RTA. Arrows indicate the most abundantly expressed KSHV genes. (C) Specificity of RNA encapsidation by KSHV virion. Graphs show the ratio of virion-encapsidated mRNA to that in induced TRExBCBL1-RTA cells. The ratio was calculated by dividing the number of virion-packaged transcripts copies by the number of copies expressed during lytic reactivation.
FIG 8
FIG 8
Comparative RNA-seq analysis of virions purified from induced TRExBCBL1-RTA, BAC36WT, and BAC36ΔORF59 transcomplemented with ORF59-DsRed. Total RNA extracted from micrococcal nuclease-treated virions was subjected to DNase treatment before preparing cDNA libraries using a TrueSeq RNA-seq library kit. The libraries were sequenced using HiSeq, and the sequences were mapped to the reference sequence using the RNA-seq analysis tool of CLC Genomic Workbench 7.0. Arrows indicate the location of viral gene peaks. (B) Read mappings of the ORF59 gene from sequences of BAC36WT virions and BAC36ΔORF59 virions complemented with ORF59-DsRed using pLVxDsRed-ORF59 as a reference. ORF59-DsRed-complemented virions showed read mapping to the ORF59-DsRed fusion protein.
FIG 9
FIG 9
De novo infection of PBMCs with BAC36WT and BAC36ΔORF59 virions. (A) Virions were purified from culture supernatant of approximately 9 × 10⁸ reactivated 293L cells harboring either BAC36WT or BAC36ΔORF59 on a 20 to 50% sucrose gradient. The three white bands as indicated represent A-type (empty), B-type (intermediate), and C-type (mature) KSHV virus particles, respectively. (B) Supernatants from 293L cells containing BAC36WT or BAC36ΔORF59 were used for real-time qPCR quantification of viral genome copies using ORF73-specific primers along with ORF73 plasmid standards. (C) Human PBMCs were infected with KSHV isolated from reactivated 293L cells containing BAC36WT or BAC36ΔORF59, with a multiplicity of infection (MOI) of 10. De novo-infected PBMCs were harvested at 4 h, 24 h, 48 h, 72 h, 96 h, and 120 h postinfection, followed by extraction of total DNA using a modified Hirt lysis method. This DNA was used for analyzing the genome copy number by real-time qPCR using ORF73-specific primers and ORF73 plasmid as a standard.
FIG 10
FIG 10
Expression profiles of viral genes in BAC36WT and BAC36ΔORF59 at different times postinfection. Normalized expression (RPKM values) of viral genes in BAC36WT and BAC36ΔORF59 at different times postinfection was used for generating hierarchal clustering. (A) Relative expression of KSHV genes at 4 h postinfection of PBMCs with BAC36WT and BAC36ΔORF59 virions. (B) Relative expression of KSHV genes at 24 h postinfection of PBMCs with BAC36WT and BAC36ΔORF59 virions. (C) Relative expression of KSHV genes at 48 h postinfection of PBMCs with BAC36WT and BAC36ΔORF59 virions. The red boxes encircle KSHV genes required for lytic DNA replication. The latency-associated gene (LANA), which showed early expression in cells infected with BAC36ΔORF59, is indicated with a green arrow.

Similar articles

Cited by

References

    1. Moore PS, Chang Y. 2010. Why do viruses cause cancer? Highlights of the first century of human tumour virology. Nat Rev Cancer 10:878–889. doi:10.1038/nrc2961. - DOI - PMC - PubMed
    1. Moore PS, Chang Y. 2003. Kaposi's sarcoma-associated herpesvirus immunoevasion and tumorigenesis: two sides of the same coin? Annu Rev Microbiol 57:609–639. doi:10.1146/annurev.micro.57.030502.090824. - DOI - PMC - PubMed
    1. Verma SC, Robertson ES. 2003. Molecular biology and pathogenesis of Kaposi sarcoma-associated herpesvirus. FEMS Microbiol Lett 222:155–163. doi:10.1016/S0378-1097(03)00261-1. - DOI - PubMed
    1. Fakhari FD, Dittmer DP. 2002. Charting latency transcripts in Kaposi's sarcoma-associated herpesvirus by whole-genome real-time quantitative PCR. J Virol 76:6213–6223. doi:10.1128/JVI.76.12.6213-6223.2002. - DOI - PMC - PubMed
    1. Jenner RG, Alba MM, Boshoff C, Kellam P. 2001. Kaposi's sarcoma-associated herpesvirus latent and lytic gene expression as revealed by DNA arrays. J Virol 75:891–902. doi:10.1128/JVI.75.2.891-902.2001. - DOI - PMC - PubMed

Publication types