Review
. 2015 Jan 1;5(2):150-72.
doi: 10.7150/thno.9476. eCollection 2015.

Macrophage targeted theranostics as personalized nanomedicine strategies for inflammatory diseases

Affiliations
Review

Macrophage targeted theranostics as personalized nanomedicine strategies for inflammatory diseases

Sravan Kumar Patel et al. Theranostics. .

Abstract

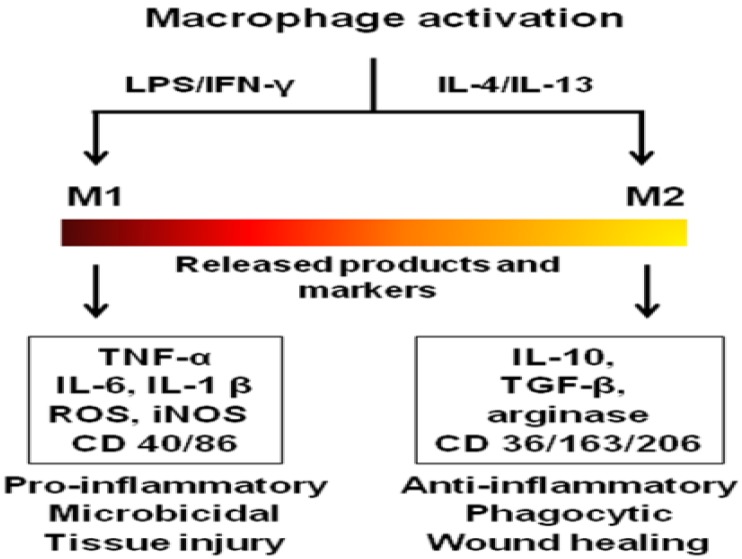
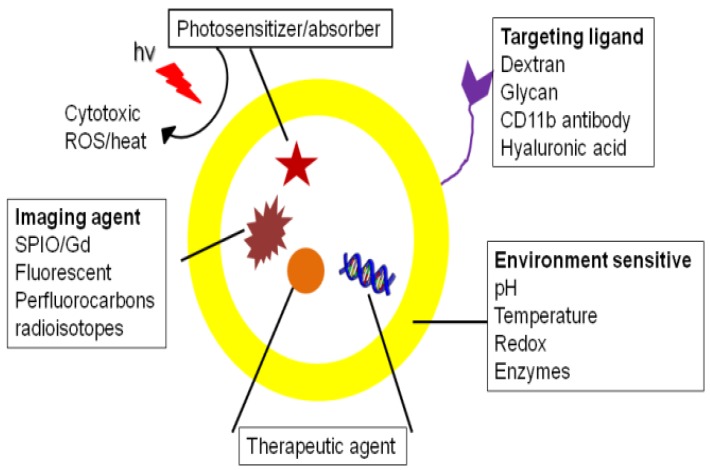
Inflammatory disease management poses challenges due to the complexity of inflammation and inherent patient variability, thereby necessitating patient-specific therapeutic interventions. Theranostics, which integrate therapeutic and imaging functionalities, can be used for simultaneous imaging and treatment of inflammatory diseases. Theranostics could facilitate assessment of safety, toxicity and real-time therapeutic efficacy leading to personalized treatment strategies. Macrophages are an important cellular component of inflammatory diseases, participating in varied roles of disease exacerbation and resolution. The inherent phagocytic nature, abundance and disease homing properties of macrophages can be targeted for imaging and therapeutic purposes. This review discusses the utility of theranostics in macrophage ablation, phenotype modulation and inhibition of their inflammatory activity leading to resolution of inflammation in several diseases.

Keywords: inflammation; macrophages; phenotype; photodynamic therapy and photothermal therapy.; theranostics.


Conflict of interest statement

Competing Interests: The authors have declared that no competing interest exists.

Figures

Figure 1
Figure 1
Activation states, released products and functions of macrophage phenotypes. The colored bar indicates macrophage phenotype continuum with M1 and M2 at the extreme ends. LPS-lipopolysaccharide (bacterial toxin), IL-interleukin; IFN-γ-interferon gamma; TNF-tumor necrosis factor; ROS-reactive oxygen species; iNOS-inducible nitric oxide synthase; TGF-transforming growth factor; CD-cluster of differentiation.
Figure 2
Figure 2
Schematic showing a theranostic with targeting, imaging and therapeutic functionalities.
Figure 3
Figure 3
PDT using dextran cross-linked iron oxide (CLIO) theranostic nanoparticles (TNP). A) 1H MRI and fluorescence images of TNPs. B) Percent cell viability, as determined by the MTS assay, of human macrophages after incubation (1 h) with the respective nanoparticles (0.2 mg Fe per mL) and light treatment (42 mWcm-2, 7.5 J). The TNP dark experiment consisted of TNP exposed cells that did not receive PDT treatment. Control cells were incubated with saline. MNP-magnetic nanoparticles, MFNP-magnetofluorescent nanoparticles (fluorescent labeled iron oxide), TNP-theranostic nanoparticles (fluorescent/iron oxide/photosensitizer). C) Phototoxicity (650 nm, 50 mWcm-2) of second generation CLIO-THPC (photosensitizer) theranostics compared with a conventional photosensitizer, chlorin e6. D) Intravital fluorescence microscopy image (top) of CLIO-THPC localized to carotid atheroma. Fluorescence image obtained in the AF750 channel demonstrates particle uptake. Fluorescence angiogram utilizing fluorescein-labeled dextran outlines the vasculature (middle). Merged image of the two fluorescence channels (bottom). E) Fluorescence microscopy (excitation: 750 nm) of an aortic root plaque section, 24 hours after fluorescent CLIO-THPC injection shows subendothelial deposition of CLIO-THPC in atheroma of atherosclerotic mouse (ApoE-/-). F) Skin photosensitivity of chlorin e6 versus CLIO-THPC based on the change in thickness in the treated edema paw 24 hours after laser irradiation (** p=0.009, * p=0.02). Figures adapted and reprinted with permission from references , .
Figure 4
Figure 4
PTT of macrophages using gold nanoroses (A-B) and carbon nanotubes (C-E) in atherosclerosis. A) PTT was performed on macrophages in vitro with a single 50 ns pulse (755 nm, 18 J/cm2). After irradiation without nanoroses, a bright field image indicates that the macrophages were intact (left). After irradiation with nanoroses, a dark field image shows a zone of macrophage ablation (right). B) Histological sections of atherosclerotic rabbit aorta injected (i.v.) with nanoroses or saline control. Macrophages (brown color RAM 11 stain) are co-present with nanoroses (bright red reflections). C) Significant decrease in macrophage viability (with SWNTs), assessed by MTT assay, 24 hours after thermal treatment (*p<0.05). D) Representative serial in vivo FMT images of a carotid-ligated mouse (top) and a sham-operated mouse (bottom) before and after injection of Cy5.5-conjugated SWNTs. The low intensity signal in sham mice represents some inflammation from the surgical procedure. E) White light image (left) and intrinsic SWNT NIR fluorescence image (right) of ex vivo ligated carotid arteries. Solid arrows point to ligated carotid artery from a mouse injected with SWNTs showing high NIR signal, but the ligated carotid artery from a mouse without SWNTs show no signal (dashed arrows). Images reproduced with permission from references , .
Figure 5
Figure 5
Studies with cytotoxic chemotherapeutic theranostics. A) T1-weighted images of a slice through a tumor-bearing mouse pre- and post- (5 min and 85 min) Gd-PLP-L theranostic administration. The red line indicates the tumor boundary and the yellow color represents contrast-enhanced pixels that show enhanced tumor accumulation at 85 min. B) T1 distribution maps of a slice through a tumor-bearing mouse before and after (2 h and 24 h) Gd-PLP-L theranostic administration, “T” represents the tumor. C) Schematic of SPIO-PLGA nanoparticles with surface Avidin for conjugation to antibodies. D) Extended release of methotrexate (MTX) and clodronate (Clod) from PLGA nanoparticles with and without SPIO. MTX and Clod shows 100% and 35% release respectively after 8 days, while iron release was negligible. Figures adapted and reproduced with permission from references , .
Figure 6
Figure 6
Macrophage phenotype modulation using iron oxide loaded PS-liposomes. A) 1H MRI showing contrast changes with the accumulation of PS liposomes (arrow). B) Cytokine analysis of supernatants from macrophage cultures exposed to PS liposomes. PS-liposomes show an increase in IL-10 and TGF-β and a reduction in TNF-α compared to saline and phosphatidyl choline (PC) liposomes. Figures adapted and reproduced with permission from reference .
Figure 7
Figure 7
MCP-1 inhibition by a fluorescent theranostic. A) FMT-CT longitudinal imaging of siCCR2 nanoparticles show spleen accumulation at 120 min (circled region). Ex vivo imaging of the organs show high fluorescence in the spleen. B) Reduced infarct risk area in siCCR2 compared to siCON, imaged by fluorescence reflectance imaging. C) X-ray CT image showing tumor reduction in an siCCR2 treated mouse compared to siCON (circled region). Figures reproduced with permission from reference .
Figure 8
Figure 8
A multimodal theranostic for COX-2 in macrophages. A) Confocal microscopy of macrophages showing cell membrane in green (FITC) and nanodroplets in red (Cellvue® burgundy dye). B) Representative 19F NMR and NIRF imaging of cells labeled with PFC theranostic. C) PGE2 estimation in supernatants of cells exposed to different treatments followed by 4 h LPS activation (*, #, $ = p<0.0001). Figures reproduced from reference .
Figure 9
Figure 9
A hydrogen peroxide sensitive anti-oxidant theranostic. A) A schematic showing formation of chemiluminescent micelles where antioxidant HPOX (HBA-incorporated copolyoxalate) and fluorescent dyes are co-incorporated in the hydrophobic core. B) Degradation of copolyoxalate in the presence of H2O2 and water releases energy which activates nearby fluorescent dye. C) Graph showing reduction of H2O2 by HPOX micelles and nanoparticles in solution, P < 0.001. D) Chemiluminescent image of H2O2 generated by locally injected HPOX micelles during LPS-induced inflammation (left). Image showing inhibited POCL reaction of HPOX micelles by H2O2 degrading catalase (right). Figures adapted and reproduced with permission from references , .

References

    1. Pene F, Courtine E, Cariou A, Mira JP. Toward theragnostics. Critical care medicine. 2009;37:S50–8. - PubMed
    1. Rai P, Mallidi S, Zheng X, Rahmanzadeh R, Mir Y, Elrington S. et al. Development and applications of photo-triggered theranostic agents. Advanced drug delivery reviews. 2010;62:1094–124. - PMC - PubMed
    1. Mura S, Couvreur P. Nanotheranostics for personalized medicine. Advanced drug delivery reviews. 2012;64:1394–416. - PubMed
    1. Janib SM, Moses AS, MacKay JA. Imaging and drug delivery using theranostic nanoparticles. Advanced drug delivery reviews. 2010;62:1052–63. - PMC - PubMed
    1. Couvreur P. Nanoparticles in drug delivery: past, present and future. Advanced drug delivery reviews. 2013;65:21–3. - PubMed