. 2014 Nov;6(11):921-30.
doi: 10.18632/aging.100701.

TAp73 promotes anti-senescence-anabolism not proliferation

Affiliations

TAp73 promotes anti-senescence-anabolism not proliferation

Massimiliano Agostini et al. Aging (Albany NY). 2014 Nov.

Abstract

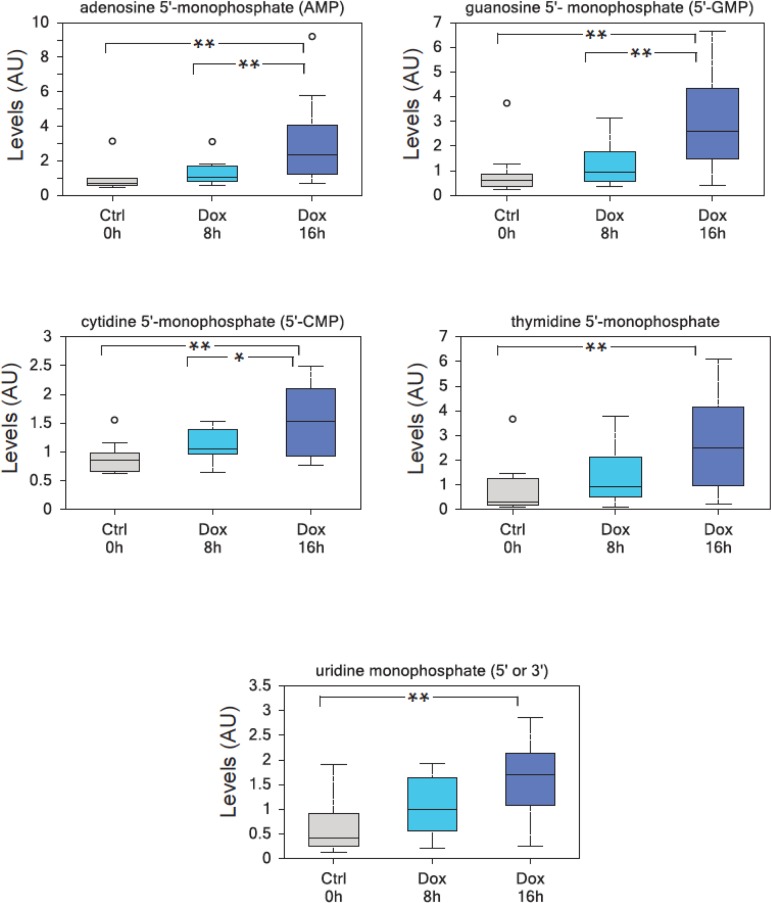
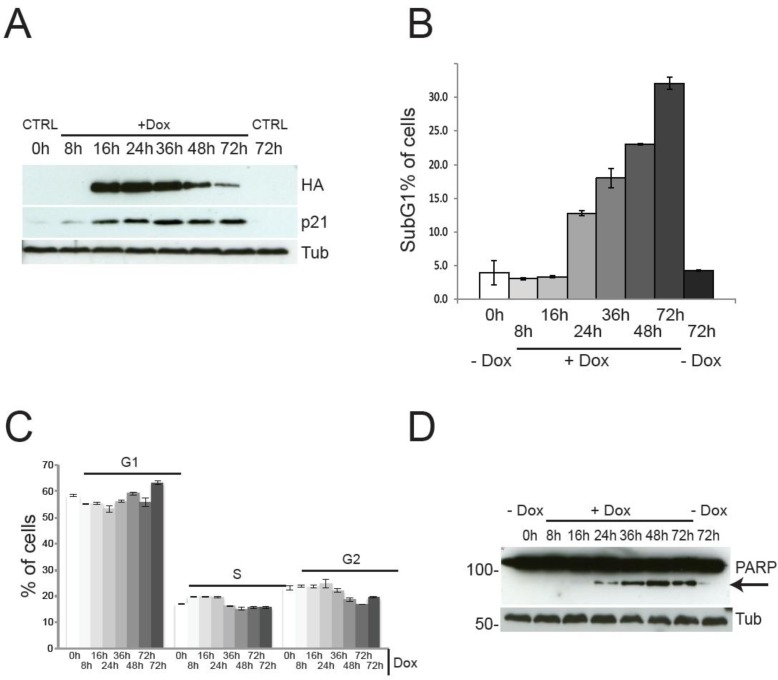
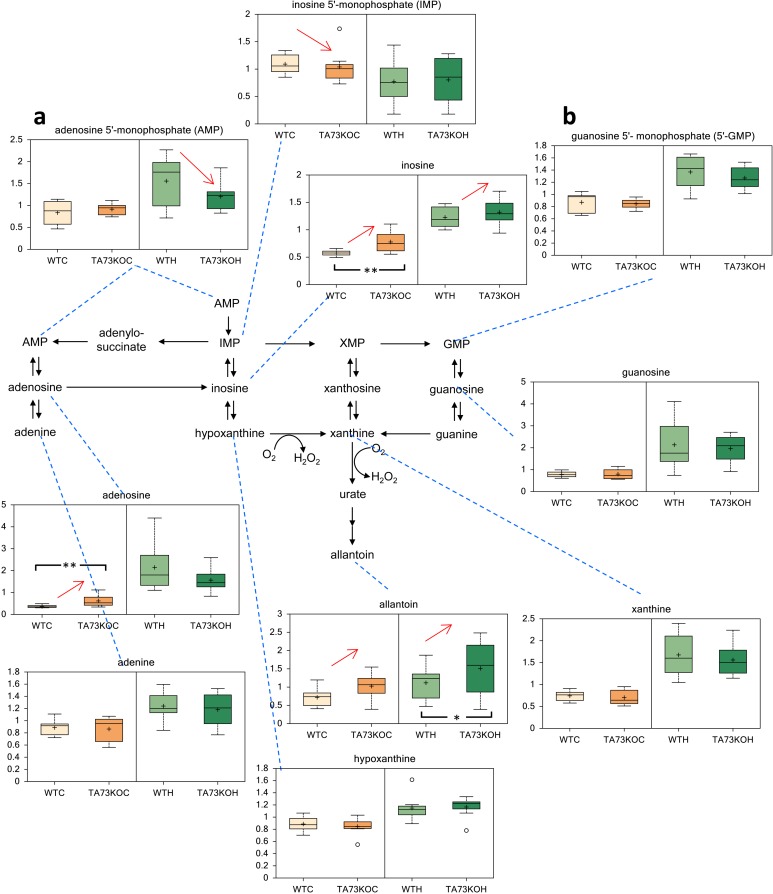
TAp73, a member of the p53 family, has been traditionally considered a tumor suppressor gene, but a recent report has claimed that it can promote cellular proliferation. This assumption is based on biochemical evidence of activation of anabolic metabolism, with enhanced pentose phosphate shunt (PPP) and nucleotide biosynthesis. Here, while we confirm that TAp73 expression enhances anabolism, we also substantiate its role in inhibiting proliferation and promoting cell death. Hence, we would like to propose an alternative interpretation of the accumulating data linking p73 to cellular metabolism: we suggest that TAp73 promotes anabolism to counteract cellular senescence rather than to support proliferation.


Conflict of interest statement

Conflict of interest statement

The authors declare no competing financial interests

Figures

Figure 1
Figure 1. TAp73 overexpression induces nucleotide monophosphates
TAp73β overxpression in SaOs-2 Tet-On cell lines results in a highly significant enrichment in all nucleotide monophosphates, consistent with an increased metabolic demand to sustain cell growth. (a) adenosine 5′-monophosphate (AMP), (b) guanosine 5′-monophosphate (5′-GMP), (c) cytidine 5′-monophosphate (5′-CMP), (d) thymidine 5′-monophosphate, (e) uridine monophosphate (5′ or 3′-UMP). Analysis was performed on thirty million cells per samples, 10 samples were analyzed for each time point (n=10). All the samples were extracted using standard metabolic solvent extraction methods and analyzed through GC/MS and LS/MS as previously described [44]. Box indicates upper/lower quartile, bars max/min of distribution. ** p<0.05; * 0.05
Figure 2
Figure 2. Cell cycle progression and cell death by TAp73β expression
TAp73 overexpression in SaOs-2 Tet-On cell lines does not induce proliferation. (a) PARP1-cleavage (arrow) induced by TAp73β-expression confirms induction of cell death at 24h after doxycycline (2 μg/ml) addiction. (b) Cell death assessed by sub-G1 population after PI staining. Induction of cell death is evident only after 24h of TAp73 induction. Data indicate average of triplicates and standard deviation. Blue arrows indicate the time points used for metabolomics analysis (same cultures as shown here). (c) Cell cycle profile after induction of TAp73β determined by PI staining and cytofluorimetric analysis. Controls were left untreated (0h) or treated with vehicle for 72h to account for changes induced by confluence. Data indicate average of triplicates and standard deviation. Blue arrows indicate the time points used for metabolomics analysis (same cultures as shown here). (d) TAp73β and p21 expression were assessed by western blotting after treatment with doxycycline (2μg/ml) for the indicated times. TAp73 expression was detected using HA antibody to the N-terminal HA tag. Tubulin was used as loading control. Controls are as in Figure 1.
Figure 3
Figure 3. Metabolic Analysis of TAp73 KO mouse Cortex and Hippocampus
Nucleotide metabolism in TAp73 knockout (TA73KO) versus wild-type (WT) mouse cerebral cortex (C) and hippocampus (H) (n=8 biological littermate replicates; age 1 day). These are the two areas of the central nervous system that show developmental defects in the knockout mice. (a) adenosine 5′-monophosphate (AMP), (b) guanosine 5′-monophosphate (5′-GMP). Box indicates upper/lower quartile, bars max/min of distribution. * p<0.05.

References

    1. Schulze A, Harris AL. How cancer metabolism is tuned for proliferation and vulnerable to disruption. Nature. 2012;491:364–373. - PubMed
    1. Hanahan D, Weinberg RA. Hallmarks of cancer: the next generation. Cell. 2011;144:646–674. - PubMed
    1. Markert EK, Levine AJ, Vazquez A. Proliferation and tissue remodeling in cancer: the hallmarks revisited. Cell death & disease. 2012;3:e397. - PMC - PubMed
    1. Zhao Y, Butler EB, Tan M. Targeting cellular metabolism to improve cancer therapeutics. Cell death & disease. 2013;4:e532. - PMC - PubMed
    1. Sotgia F, Martinez-Outschoorn UE, Lisanti MP. Cancer metabolism: new validated targets for drug discovery. Oncotarget. 2013;4:1309–1316. - PMC - PubMed

Publication types

MeSH terms