

doi: 10.1103/PhysRevLett.113.258101.
Epub 2014 Dec 16.
Scaling of gene expression with transcription-factor fugacity
Affiliations
- PMID: 25554908
- PMCID: PMC4386862
- DOI: 10.1103/PhysRevLett.113.258101
Item in Clipboard
Scaling of gene expression with transcription-factor fugacity
Phys Rev Lett.
.
Abstract
The proteins associated with gene regulation are often shared between multiple pathways simultaneously. By way of contrast, models in regulatory biology often assume these pathways act independently. We demonstrate a framework for calculating the change in gene expression for the interacting case by decoupling repressor occupancy across the cell from the gene of interest by way of a chemical potential. The details of the interacting regulatory architecture are encompassed in an effective concentration, and thus, a single scaling function describes a collection of gene expression data from diverse regulatory situations and collapses it onto a single master curve.
Figures
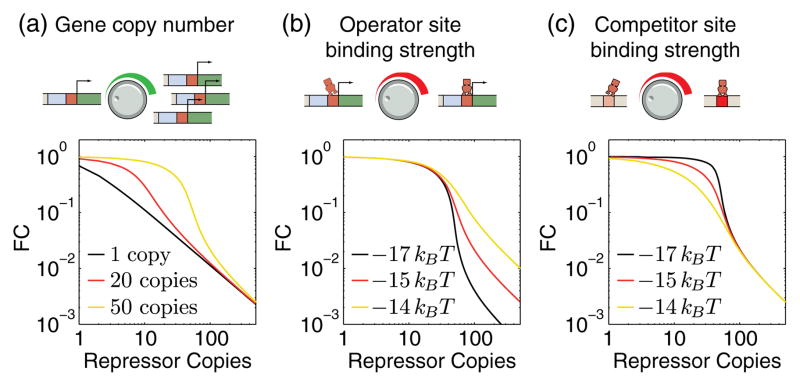
Predicted regulatory response. Examples of parameters to tune the competition for transcription factors for the case of a simple repression regulatory architecture and the predicted fold change in gene expression (FC) as a function of the repressor copy number. (a) The gene copy number determines at what value of the repressor copy number the gene shifts from being unrepressed to being repressed. (b) The operator site strength effects the fold change in expression at high repressor copy numbers in the presence of a fixed number (50) of identical genes. (c) The binding strength of competing binding sites effects the sharpness of the transition between unrepressed and repressed state for a fixed operator site binding strength of −15kBT.
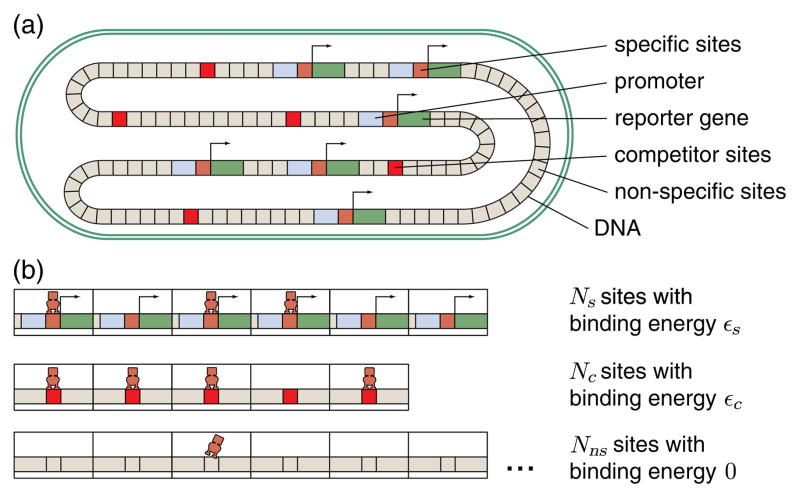
(a) Schematic of chromosome when viewed as a lattice of possible binding sites that can be occupied (or not) by a repressor. Within the cell are multiple identical, regulated promoters (that produce a measurable gene product), “competitor sites” that bind the repressor stronger than a nonspecific interaction but do not regulate a gene, and nonspecific sites that each bind the repressor weakly. (b) In the grand canonical framework, each of these types of binding site is treated as a lattice of possible binding sites, characterized by the number of sites in the lattice N and the energy with which each site binds the transcription factor ε, with a chemical potential responsible for maintaining balance between the number of molecules bound on each lattice.
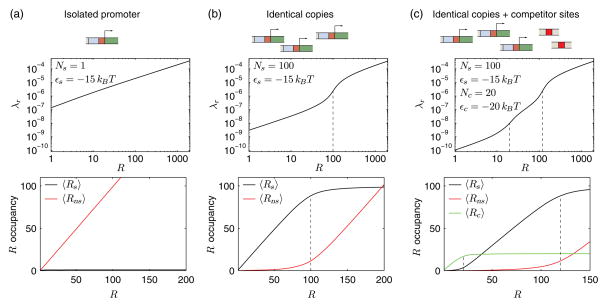
Functional form of the fugacity λr and occupancies of repressor binding sites for different situations. (a) A single isolated promoter. The single specific repressor binding site in the promoter region is filled up immediately, and almost all repressors are bound to the nonspecific sites. (b) Multiple identical copies of the promoter. The specific repressor binding sites are filled up first, before the repressors bind to the nonspecific sites with a 15kBT higher binding energy. The fugacity of the repressors increases abruptly at R = Ns, marked by dashed vertical lines. (c) Multiple identical copies of the promoter and multiple competitor sites. The repressors fill up the competitor binding sites with the lowest repressor binding energy of εc = −20kBT, before binding to the specific binding sites and finally to the nonspecific sites. The fugacity increases abruptly at R = Ns and R = Ns + Nc, marked by the dashed vertical lines.
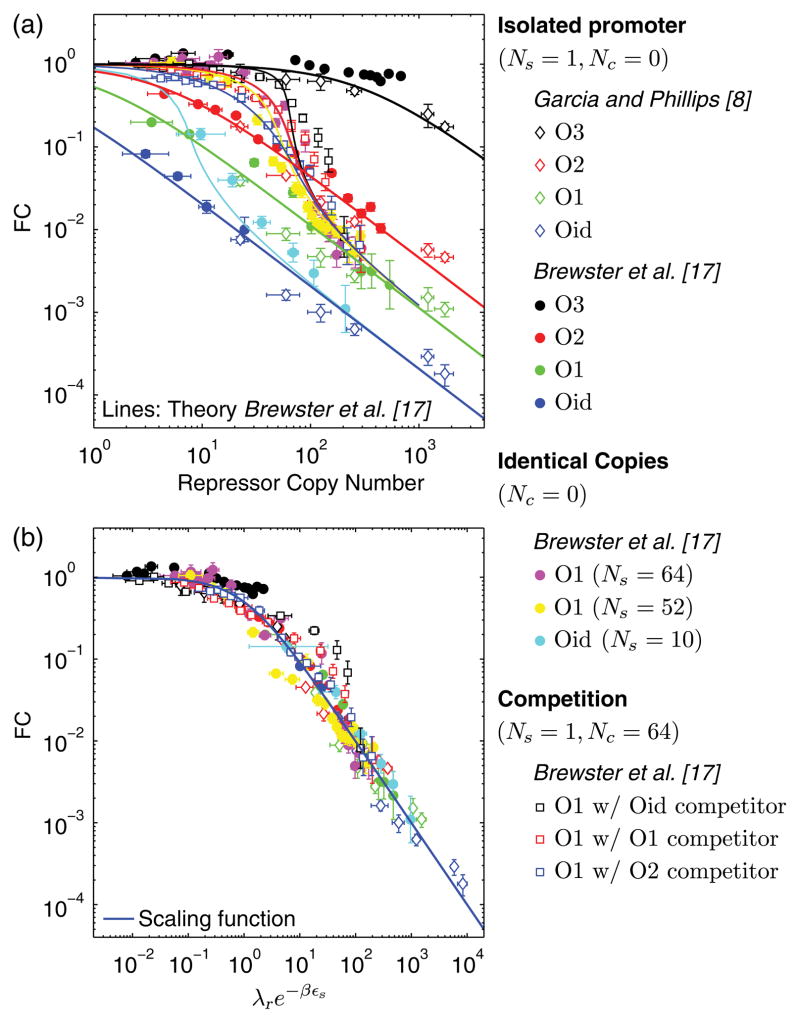
Gene expression data by Garcia and Phillips [8] and Brewster et al. [17] for various regulatory scenarios. (a) The data and theory plotted versus the repressor copy number R shows a variety of functional forms. (b) The data rescaled to collapse to the same functional form. The blue solid line is the prediction from Eq. (5) without fitting parameter. The repressor binding energies are taken from Ref. [8] as ε = −9.7kBT for O3, ε = −13.9kBT for O2, ε = −15.3kBT for O1, ε = −17.0kBT for Oid. Values for copy numbers of promoters Ns or competitor binding sites Nc are measured in Ref. [17] by qPCR. For each data set, λr is calculated using these parameters and Eq. (10).
References
Publication types
MeSH terms
Substances
Grants and funding
LinkOut - more resources
Full Text Sources
Other Literature Sources