Randomized Controlled Trial

TLR4 genotype and environmental LPS mediate RSV bronchiolitis through Th2 polarization

Mauricio T Caballero et al. J Clin Invest. 2015 Feb.

Abstract

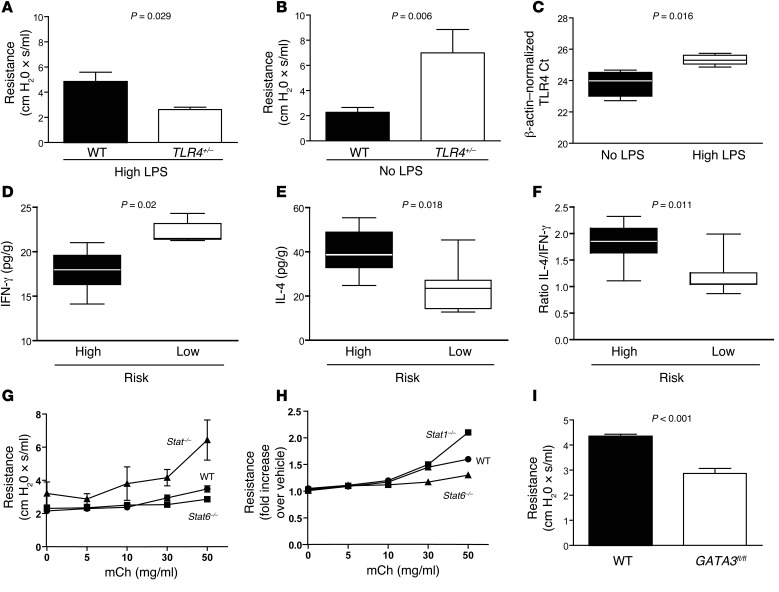
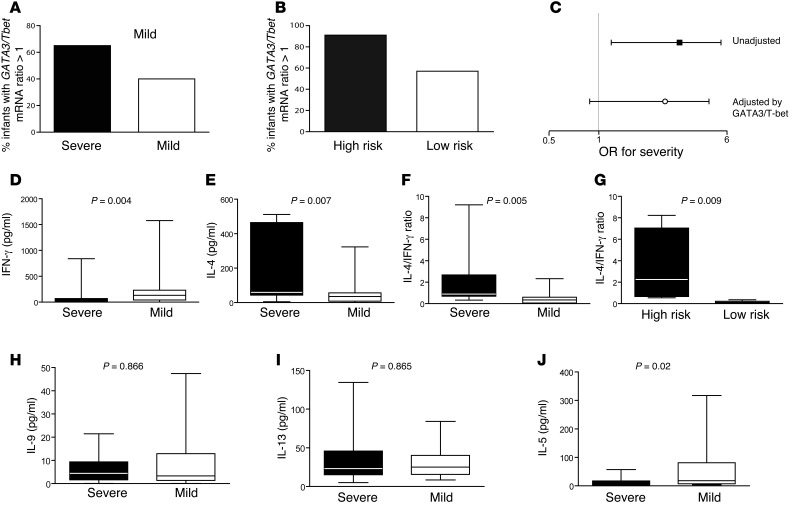
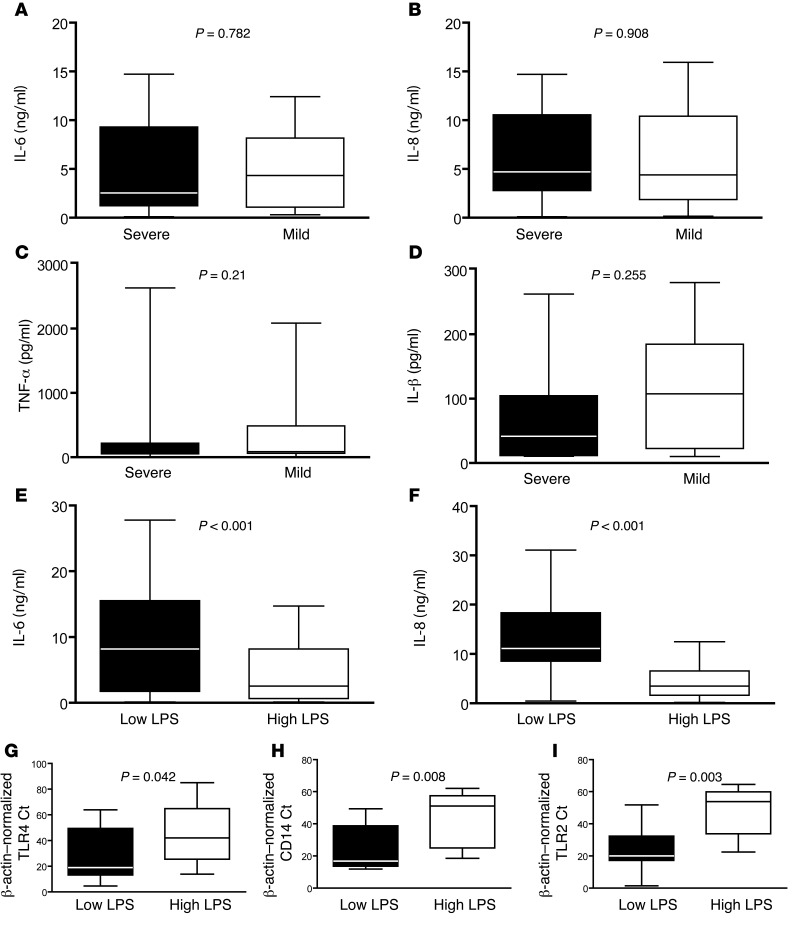
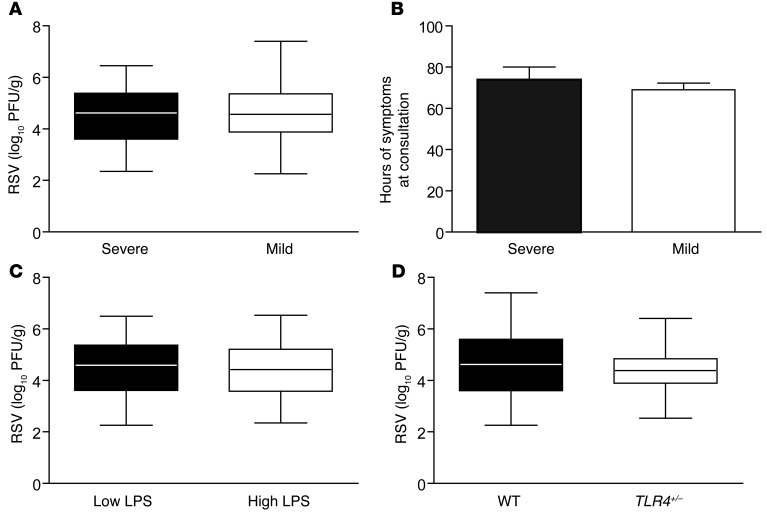
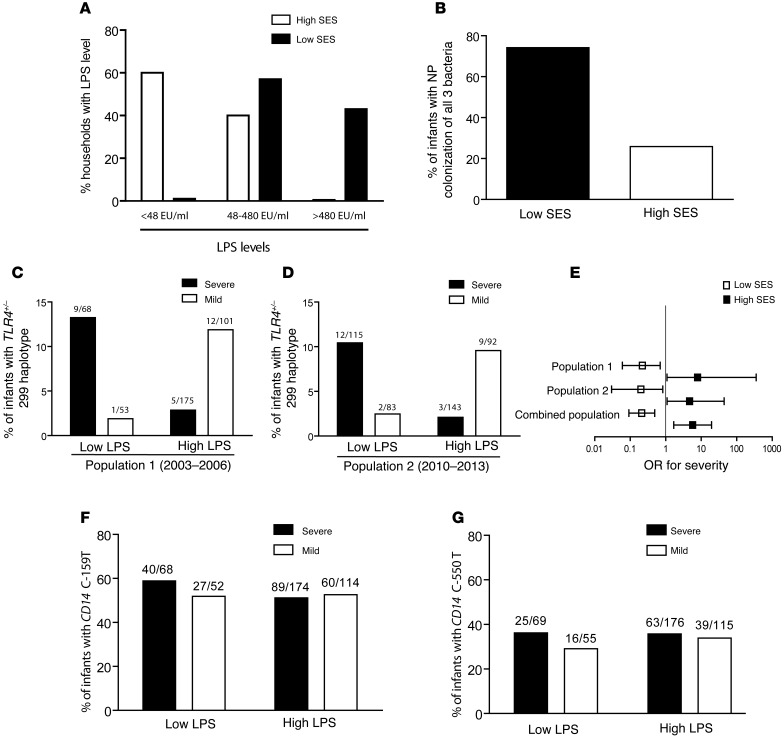
While 30%-70% of RSV-infected infants develop bronchiolitis, 2% require hospitalization. It is not clear why disease severity differs among healthy, full-term infants; however, virus titers, inflammation, and Th2 bias are proposed explanations. While TLR4 is associated with these disease phenotypes, the role of this receptor in respiratory syncytial virus (RSV) pathogenesis is controversial. Here, we evaluated the interaction between TLR4 and environmental factors in RSV disease and defined the immune mediators associated with severe illness. Two independent populations of infants with RSV bronchiolitis revealed that the severity of RSV infection is determined by the TLR4 genotype of the individual and by environmental exposure to LPS. RSV-infected infants with severe disease exhibited a high GATA3/T-bet ratio, which manifested as a high IL-4/IFN-γ ratio in respiratory secretions. The IL-4/IFN-γ ratio present in infants with severe RSV is indicative of Th2 polarization. Murine models of RSV infection confirmed that LPS exposure, Tlr4 genotype, and Th2 polarization influence disease phenotypes. Together, the results of this study identify environmental and genetic factors that influence RSV pathogenesis and reveal that a high IL-4/IFN-γ ratio is associated with severe disease. Moreover, these molecules should be explored as potential targets for therapeutic intervention.


Figures

Figure 5
Figure 5. Th2 bias promotes RSV disease in mice.
AHR in mice exposed to 50 mg aerosolized mCh 5 days after i.n. infection with 106 PFU RSV line 19 after high (100 μg qod) (A) or no (B) exposure to bacterial LPS. Student’s t test; P = 0.029 (A) and P = 0.006 (B) for WT versus Tlr4+/–. No statistically significant differences were observed between uninfected WT and Tlr4+/– controls (not shown). Results are representative of duplicate experiments (6–8 mice/group). (C) TLR4 mRNA expression levels in WT mice exposed to high LPS levels versus no LPS. P = 0.012. (D) IFN-γ, (E) IL-4, and (F) IL-4/IFN-γ ratios in lung homogenates of high-risk (no LPS exposure for Tlr4+/– plus high LPS exposure for WT) compared with low-risk (no LPS exposure for WT plus high-level LPS exposure for Tlr4+/–) mice 5 days after inoculation with RSV line 19. P = 0.002 for IFN-γ, P = 0.018 for IL-4, and P = 0.011 for IL-4/IFN-γ ratios; Mann-Whitney U test for DF. 6–9 mice/group. (G and H) AHR in BALB/c (WT), Stat1–/– (deficient T-bet activation), and Stat6–/– (deficient GATA3 activation) mice exposed to aerosolized mCh 5 days after infection with 106 PFU RSV line 19. P <0.05 for Stat1–/– versus WT and Stat6–/– and P < 0.05 for Stat6–/– versus WT in E; ANOVA with Tukey’s post test. Data represent the mean ± SEM. No significant differences were observed between uninfected controls. Results are representative of duplicate experiments (5 mice/group). (I) AHR in RSV-infected, tamoxifen-treated C57BL/6 WT and in mice conditionally deficient for GATA3 (GATA3fl/fl). P < 0.05 by Mann-Whitney U test. Data represent the mean ± SEM (5 mice/group).
Figure 4
Figure 4. Th2 bias and RSV bronchiolitis.
(A) Percentage of RSV-infected infants with severe or mild RSV bronchiolitis with a GATA3/Tbet mRNA ratio greater than 1 in respiratory secretions. P = 0.02 by χ2 test. (B) Percentage of high-risk (WT and high-level LPS exposure plus TLR4 D299G and low-level LPS exposure; black bar) and low-risk (WT and low-level LPS exposure plus TLR4 D299G and high-level LPS exposure; white bar) RSV-infected infants with a GATA3/Tbet mRNA ratio greater than 1 in respiratory secretions. P < 0.0001 by χ2 test. (C) Effect of TLR4-environment interaction on severity of RSV bronchiolitis in unadjusted analysis and after adjusting for GATA3/T-bet ratios greater than 1. (D) IFN-γ, (E) IL-4, and (F) IL-4/IFN-γ levels in respiratory secretions from infants with severe (black bar) or mild (white bar) RSV bronchiolitis (range = 0.33–9.2 for severe in IL-4/IFN-γ and 0.01–2.3 for mild). Data represent the mean ± SEM. (G) IL-4/ IFN-γ levels in respiratory secretions from high- (black bar) or low- (white bar) risk infants. Data represent the mean ± SEM. (H) IL-9, (I) IL-13, and (J) IL-5 levels in respiratory secretions from infants with severe (black bar) or mild (white bar) RSV bronchiolitis. Data represent the mean ± SEM. Mann-Whitney U test for DJ.
Figure 3
Figure 3. Inflammation in the lungs is determined by environmental exposure.
(A) IL-6, (B) IL-8, (C) TNF-α, and (D) IL-1β levels in respiratory secretions from infants with severe (black bars) or mild (white bars) bronchiolitis. P = NS for all comparisons. Data represent the mean ± SEM. (E) IL-6 and (F) IL-8 levels in respiratory secretions from infants from urban homes with low NP bacterial carriage, high SES, and low LPS exposure levels (Low LPS) and infants from rural homes with high NP bacterial carriage, indicators of low SES with exposure to high environmental levels of LPS (High LPS). P = 0.04 for Il-6; P = 0.003 for IL-8. Data represent the mean ± SEM. (GI) TLR4, CD14, and TLR2 mRNA expression in respiratory secretions from healthy infants exposed to low (black bar) or high (white bar) environmental levels of LPS. P < 0.01 for all comparisons by Mann-Whitney U test.
Figure 2
Figure 2. RSV lung titers are not associated with severity.
(A) RSV titers in respiratory secretions from infants with severe (black box) or mild (white box) bronchiolitis; P = 0.659. Data represent the mean ± SEM. (B) Time from initiation of symptoms to collection of respiratory secretions in RSV-infected infants with severe (black bars) or mild (white bars) bronchiolitis. P = 0.990. (C) RSV titer in respiratory secretions from infants from rural homes with high NP bacterial carriage, indicators of low SES, and exposure to high environmental levels of LPS (High LPS; white box) and infants from urban homes with low NP bacterial carriage, middle SES, and low LPS exposure levels (Low LPS; black box). P = 0.608. Data represent the mean ± SEM. (D) RSV titers in respiratory secretions from RSV-infected infants with 2 major alleles (black box) and infants with 1 TLR4 D299G allele (white box). P = 0.399. All statistical analyses were performed using 2-tailed Student’s t tests.
Figure 1
Figure 1. Pattern recognition receptors and environmental interactions.
(A) LPS concentrations categorized as low (<48 EU/ml), medium (48–480 EU/ml), and high (>480 EU/ml), as determined using an LAL assay in cradles and bed sheets of infants from low- versus middle-SES groups. P < 0.01 by Fisher’s exact test. (B) Diversity of NP colonization, defined as carriage of all 3 S. pneumoniae, H. influenzae, and M. catarrhalis bacteria in a convenience sample of 100 infants of low SES versus those of high SES. Percentage of infants with detectable bacterial DNA. P < 0.001 by χ2 test. (C and D) Association of the TLR4 Asp299Gly heterozygous genotype in RSV-infected infants with mild (white bars) or severe (black bars) bronchiolitis in groups of infants from rural homes with high NP bacterial carriage, indicators of low SES, exposure to high environmental levels of LPS (High LPS), and groups of infants from urban homes with low NP bacterial carriage, middle-SES status, and low LPS exposure levels (Low LPS) in 2003–2006 (C; P = 0.003 for interaction) and 2010–2013 (D; P = 0.002 for interaction). (E) ORs and 95% CIs for disease severity in infants from high and low LPS level environments in population 1 (2003–2006), population 2 (2010–2013), and both populations combined (P < 0.001 for interaction in combination). Fisher’s exact and Zelen’s exact tests for CE (see Table 1). (F) CD14 C-159T and (G) CD14 C-550T alleles in RSV-infected infants with severe (black bars) or mild (white bars) bronchiolitis in groups exposed to low or high environmental levels of LPS. Fisher’s exact; P = NS for both alleles.

References

    1. Collins PL, Chanock RM, Murphy BR. Respiratory syncytial virus disease. In: Knipe D, et al., eds. Fields Virology. 4th ed. Vol.1. Philadelphia, Pennsylvania, USA: Lippincott Williams & Wilkins; 2001:1443–1486.
    1. Simoes EA. Environmental and demographic risk factors for respiratory syncytial virus lower respiratory tract disease. J Pediatr. 2003;143(5 suppl):S118–S126. - PubMed
    1. Ferolla FM, et al. Macronutrients during pregnancy and life-threatening respiratory syncytial virus infections in children. Am J Respir Crit Care Med. 2013;187(9):983–990. doi: 10.1164/rccm.201301-0016OC. - DOI - PubMed
    1. Hoffman SJ, Laham FR, Polack FP. Mechanisms of illness during respiratory syncytial virus infection: the lungs, the virus and the immune response. Microbes Infect. 2004;6(8):767–772. doi: 10.1016/j.micinf.2004.03.010. - DOI - PubMed
    1. Karron RA, et al. Identification of a recombinant live attenuated respiratory syncytial virus vaccine candidate that is highly attenuated in infants. J Infect Dis. 2005;191(7):1093–1104. doi: 10.1086/427813. - DOI - PubMed

Publication types

MeSH terms