. 2015 Feb;125(2):769-81.
doi: 10.1172/JCI77588. Epub 2015 Jan 2.

Differences in hypothalamic type 2 deiodinase ubiquitination explain localized sensitivity to thyroxine

Differences in hypothalamic type 2 deiodinase ubiquitination explain localized sensitivity to thyroxine

Joao Pedro Werneck de Castro et al. J Clin Invest. 2015 Feb.

Abstract

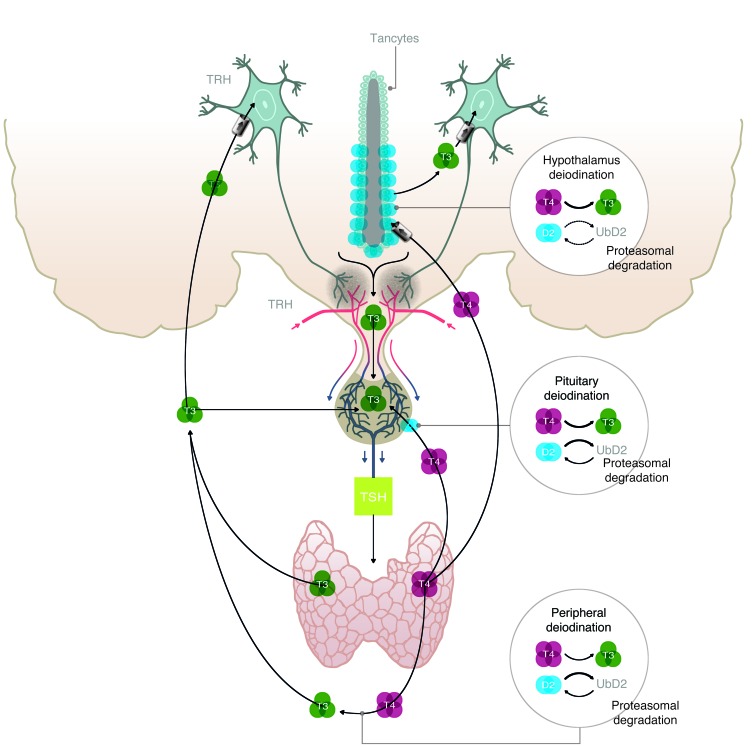
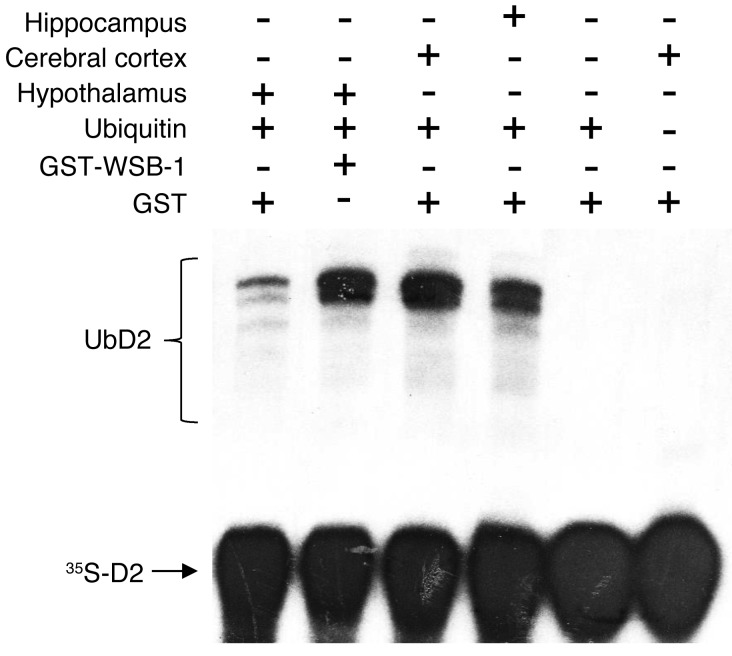
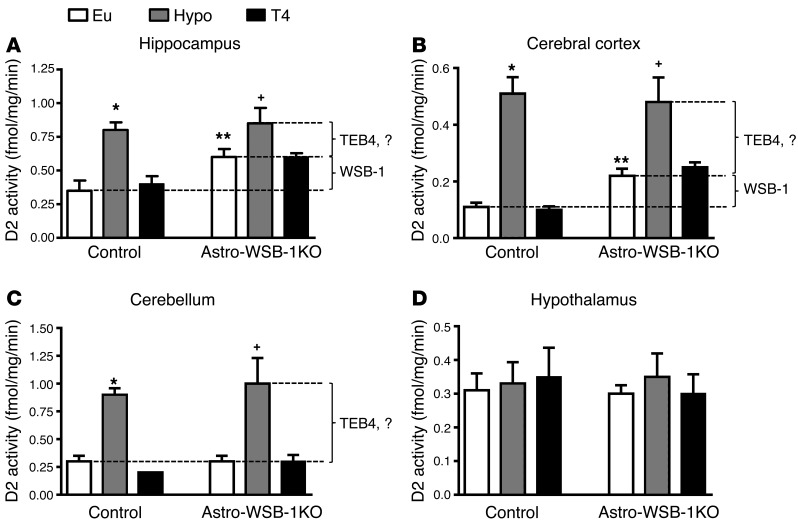
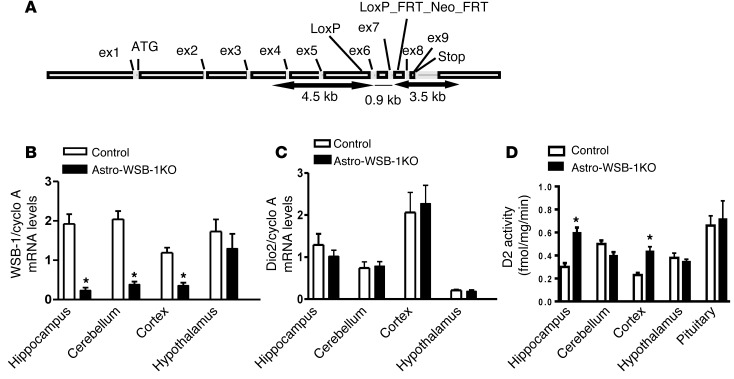
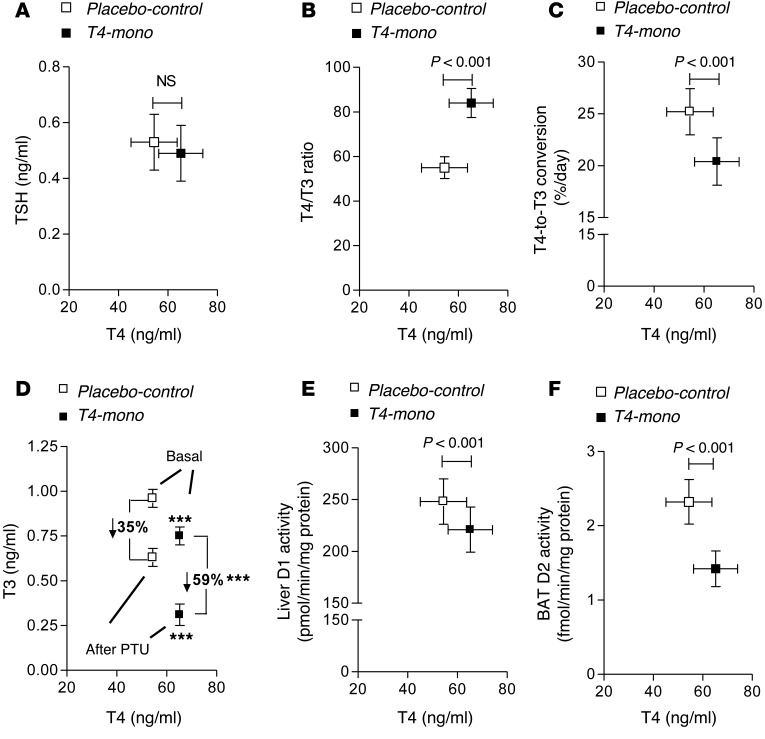
The current treatment for patients with hypothyroidism is levothyroxine (L-T4) along with normalization of serum thyroid-stimulating hormone (TSH). However, normalization of serum TSH with L-T4 monotherapy results in relatively low serum 3,5,3'-triiodothyronine (T3) and high serum thyroxine/T3 (T4/T3) ratio. In the hypothalamus-pituitary dyad as well as the rest of the brain, the majority of T3 present is generated locally by T4 deiodination via the type 2 deiodinase (D2); this pathway is self-limited by ubiquitination of D2 by the ubiquitin ligase WSB-1. Here, we determined that tissue-specific differences in D2 ubiquitination account for the high T4/T3 serum ratio in adult thyroidectomized (Tx) rats chronically implanted with subcutaneous L-T4 pellets. While L-T4 administration decreased whole-body D2-dependent T4 conversion to T3, D2 activity in the hypothalamus was only minimally affected by L-T4. In vivo studies in mice harboring an astrocyte-specific Wsb1 deletion as well as in vitro analysis of D2 ubiquitination driven by different tissue extracts indicated that D2 ubiquitination in the hypothalamus is relatively less. As a result, in contrast to other D2-expressing tissues, the hypothalamus is wired to have increased sensitivity to T4. These studies reveal that tissue-specific differences in D2 ubiquitination are an inherent property of the TRH/TSH feedback mechanism and indicate that only constant delivery of L-T4 and L-T3 fully normalizes T3-dependent metabolic markers and gene expression profiles in Tx rats.


Figures

Figure 5
Figure 5. Illustration depicting the fundamentals of the hypothalamic-pituitary-thyroid axis, including the different sites in which T4-induced D2 ubiquitination plays a role in thyroid hormone homeostasis.
TRH-expressing neurons release TRH in the portal blood, which is transported to the anterior pituitary. There, TSH is secreted and stimulates the thyroid to produce T4 and T4. In most tissues, exposure to T4 accelerates D2 inactivation by ubiquitination and its targeting to the proteasomal system. UbD2 can also be reactivated and rescued from proteasomal destruction by DUB-mediated deubiquitination. The present findings indicate that peripheral deiodination is very sensitive to T4-induced D2 ubiquitination, and thus a mild elevation in the serum T4/T3 ratio favors D2 inactivation and decreases fractional conversion of T4 to T3 and peripheral T3 production. A similar situation is seen in different regions of the brain where the elevated serum T4/T3 ratio results in a gene expression profile typical of hypothyroidism. In contrast, hypothalamic D2 is less susceptible to T4-induced ubiquitination, and/or deubiquitination is so effective in this tissue that T4-induced D2 inactivation is insignificant. As a result, T4 signaling via D2-mediated T3 production is very effective in the hypothalamus, whereas T3 production via D2 is easily inhibited in the periphery. The situation in the pituitary thyrotrophs is probably intermediary between these two extremes on the basis of previously published data (18). This explains the discrepancy between normalization of TSH secretion and peripheral T3 production observed in L-T4–treated Tx rats.
Figure 4
Figure 4. In vitro D2 ubiquitination driven by fraction II purified from the indicated tissues.
Autoradiography of an SDS-PAGE identifying 35S-ubiquitinated D2 (UbD2) produced in vitro. Addition of different components to the reaction mixture was as indicated. Fraction II from different tissues was added as indicated. This experiment was repeated twice with similar results.
Figure 3
Figure 3. D2 activity in different areas of the brains of Astro-WSB-1KO and GFAP-Cre littermate controls.
(A) Hippocampus. (B) Cerebral cortex. (C) Cerebellum. (D) Hypothalamus. In AD as indicated, some animals in both groups were made hypothyroid (Hypo) and subsequently treated with L-T4 (T4) for 2 weeks; other animals remained euthyroid (Eu). Results are expressed as mean ± SD of 5–6 animals per group. *P < 0.01 vs. Eu and T4 (GFAP-Cre littermate control); **P < 0.05 vs. Eu (GFAP-Cre littermate control); +P < 0.05 vs. Eu (Astro-WSB-1KO). The lines and the brackets labeled WSB-1 or TEB4 indicate the estimated role of each ubiquitin ligase in regulating D2 activity.
Figure 2
Figure 2. Studies of the Astro-WSB-1KO mouse.
(A) Scheme of the mouse Wsb1 gene showing the 2 LoxP sites flanking exons 6 and 7. When the Wsb1fl/fl mouse is crossed with the GFAP-Cre mouse, exons 6 and 7 are floxed out and a frame stop codon is formed in exon 8 that prevents translation of the SOCS box located in exon 9. (B) Wsb1 mRNA levels in the hippocampus, cerebellum, cerebral cortex, and hypothalamus of Astro-WSB-1KO and littermate control mice. (C) Same as in B, except that Dio2 mRNA levels are shown. (D) Same as in C, except that D2 activity is shown. (BD) Results are expressed as mean ± SD of 5–6 animals per group. *P < 0.01 vs. GFAP-Cre littermate control mice.
Figure 1
Figure 1. Parameters of thyroid economy in placebo-control and T4-mono rats plotted as a function of serum T4.
(A) Serum TSH. (B) Serum T4/T3 ratio. (C) T4-to-T3 fractional conversion. (D) Absolute drop in serum T3 48 hours after daily PTU administration; the percentage drop is also indicated for each group. ***P < 0.001 vs. placebo-control rats. (E) Liver D1 activity. (F) BAT D2 activity. All entries in AF are the mean ± SD (n = 49–94 per group).

References

    1. Garber JR, et al. Clinical practice guidelines for hypothyroidism in adults: cosponsored by the American Association of Clinical Endocrinologists and the American Thyroid Association. Thyroid. 2012;22(12):1200–1235. doi: 10.1089/thy.2012.0205. - DOI - PubMed
    1. Singer PA, et al. Treatment guidelines for patients with hyperthyroidism and hypothyroidism. Standards of Care Committee, American Thyroid Association. JAMA. 1995;273(10):808–812. - PubMed
    1. Stock JM, Surks MI, Oppenheimer JH. Replacement dosage of L-thyroxine in hypothyroidism. A re-evaluation. N Engl J Med. 1974;290(10):529–533. doi: 10.1056/NEJM197403072901001. - DOI - PubMed
    1. Wiersinga WM, Duntas L, Fadeyev V, Nygaard B, Vanderpump MP. 2012 ETA Guidelines: The Use of L-T4 + L-T3 in the Treatment of Hypothyroidism. Eur Thyroid J. 2012;1(2):55–71. doi: 10.1159/000339444. - DOI - PMC - PubMed
    1. Alevizaki M, Mantzou E, Cimponeriu AT, Alevizaki CC, Koutras DA. TSH may not be a good marker for adequate thyroid hormone replacement therapy. Wien Klin Wochenschr. 2005;117(18):636–640. doi: 10.1007/s00508-005-0421-0. - DOI - PubMed

Publication types

MeSH terms