

Postprandial effects of polydextrose on satiety hormone responses and subjective feelings of appetite in obese participants
- PMID: 25555562
- PMCID: PMC4320494
- DOI: 10.1186/1475-2891-14-2
Postprandial effects of polydextrose on satiety hormone responses and subjective feelings of appetite in obese participants
Abstract
Background: Dietary fibers are associated with enhanced satiety. However, the mechanism of different dietary fibers contributing to satiety-related gastrointestinal (GI) peptide release, especially in an obese population, is still poorly understood. Polydextrose (PDX), a water-soluble glucose polymer, has demonstrated its ability to reduce energy intake at a subsequent meal, but its mechanism of action requires further research. Also, there is limited evidence on its capacity to regulate subjective feelings of appetite. This study examines the effects of PDX on postprandial secretion of satiety-related GI peptides, short chain fatty acids (SCFAs), lactic acid, and subjective appetite ratings in obese participants.
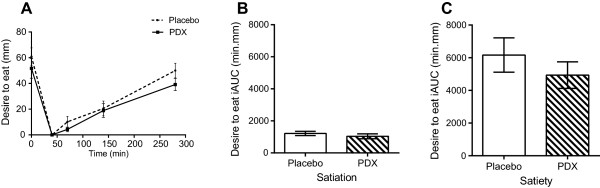
Methods: 18 non-diabetic, obese participants (42.0 y, 33.6 kg/m2) consumed a high-fat meal (4293 kJ, 36% from fat) with or without PDX (15 g) in an acute, multicenter, randomized, double-blind, placebo-controlled and crossover trial. Postprandial plasma concentrations of satiety-related peptides, namely ghrelin, cholecystokinin (CCK), glucagon-like peptide 1 (GLP-1), and peptide YY (PYY), as well as SCFAs and lactic acid were assessed. GI peptide, SCFA and lactate concentrations were then modeled using a linear mixed-effects model.The subjective feelings of hunger, satisfaction, and desire to eat were evaluated using visual analogue scales (VAS), which were analyzed as incremental areas under the curve (iAUC) during the satiation and satiety periods.
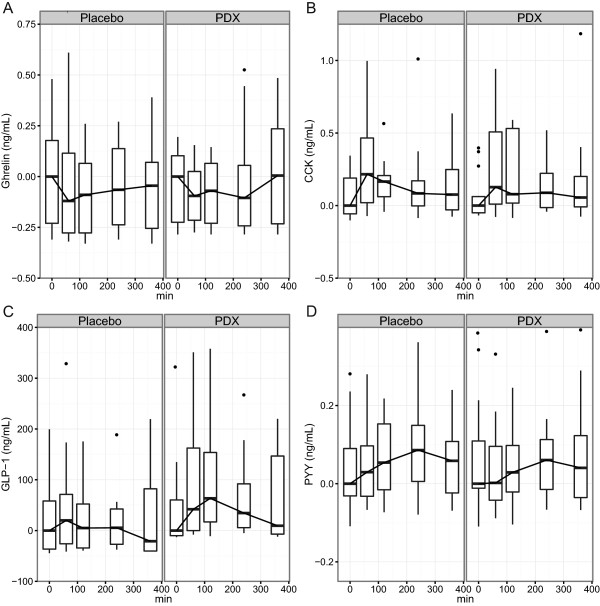
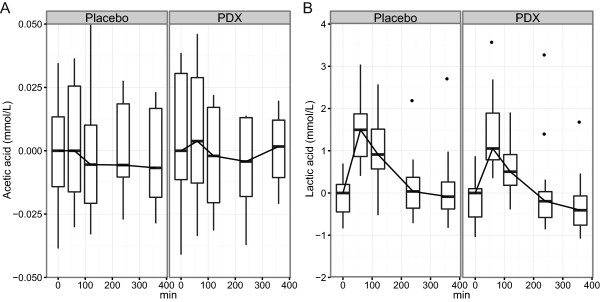
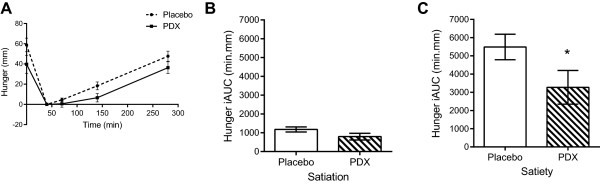
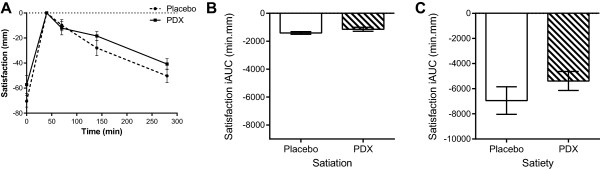
Results: We found that PDX supplementation increased plasma GLP-1 levels more than the placebo treatment (P = 0.02). In the whole group, GLP-1 concentrations found in participants older than 40 years old were significantly lower (P = 0.01) as compared to those aged 40 years or less. There were no statistically significant differences in postprandial ghrelin, CCK, or PYY responses. The lactic acid concentrations were significantly (P = 0.01) decreased in the PDX group, while no significant changes in SCFAs were found. PDX reduced iAUC for hunger by 40% (P = 0.03) and marginally increased satisfaction by 22.5% (P = 0.08) during the post-meal satiety period.
Conclusion: Polydextrose increased the postprandial secretion of the satiety hormone GLP-1 and reduced hunger after a high-fat meal. PDX also reduced the elevated postprandial lactic acid levels in plasma. Therefore, PDX may offer an additional means to regulate inter-meal satiety and improve postprandial metabolism in obese participants.
Figures
Similar articles
-
Effects of dietary fatty acid composition from a high fat meal on satiety.Appetite. 2013 Oct;69:39-45. doi: 10.1016/j.appet.2013.05.006. Epub 2013 May 18. Appetite. 2013. PMID: 23688821 Clinical Trial.
-
Effects of polydextrose with breakfast or with a midmorning preload on food intake and other appetite-related parameters in healthy normal-weight and overweight females: An acute, randomized, double-blind, placebo-controlled, and crossover study.Appetite. 2017 Mar 1;110:15-24. doi: 10.1016/j.appet.2016.12.002. Epub 2016 Dec 2. Appetite. 2017. PMID: 27916475 Clinical Trial.
-
Comparison of postprandial profiles of ghrelin, active GLP-1, and total PYY to meals varying in fat and carbohydrate and their association with hunger and the phases of satiety.J Clin Endocrinol Metab. 2013 May;98(5):E847-55. doi: 10.1210/jc.2012-3835. Epub 2013 Mar 18. J Clin Endocrinol Metab. 2013. PMID: 23509106 Clinical Trial.
-
Effect of Polydextrose on Subjective Feelings of Appetite during the Satiation and Satiety Periods: A Systematic Review and Meta-Analysis.Nutrients. 2016 Jan 14;8(1):45. doi: 10.3390/nu8010045. Nutrients. 2016. PMID: 26784221 Free PMC article.
-
How Satiating Are the 'Satiety' Peptides: A Problem of Pharmacology versus Physiology in the Development of Novel Foods for Regulation of Food Intake.Nutrients. 2019 Jul 4;11(7):1517. doi: 10.3390/nu11071517. Nutrients. 2019. PMID: 31277416 Free PMC article. Review.
Cited by
-
Postprandial triglyceride response in normolipidemic, hyperlipidemic and obese subjects - the influence of polydextrose, a non-digestible carbohydrate.Nutr J. 2015 Mar 8;14:23. doi: 10.1186/s12937-015-0009-0. Nutr J. 2015. PMID: 25889643 Free PMC article. Clinical Trial.
-
Prebiotic potential of enzymatically prepared resistant starch in reshaping gut microbiota and their respond to body physiology.PLoS One. 2022 May 16;17(5):e0267318. doi: 10.1371/journal.pone.0267318. eCollection 2022. PLoS One. 2022. PMID: 35576192 Free PMC article.
-
Polydextrose with and without Bifidobacterium animalis ssp. lactis 420 drives the prevalence of Akkermansia and improves liver health in a multi-compartmental obesogenic mice study.PLoS One. 2021 Dec 2;16(12):e0260765. doi: 10.1371/journal.pone.0260765. eCollection 2021. PLoS One. 2021. PMID: 34855861 Free PMC article.
-
Effects of high-carbohydrate versus mixed-macronutrient meals on female soccer physiology and performance.Eur J Appl Physiol. 2021 Apr;121(4):1125-1134. doi: 10.1007/s00421-021-04597-5. Epub 2021 Jan 23. Eur J Appl Physiol. 2021. PMID: 33484335 Clinical Trial.
-
Chronic consumption of a blend of inulin and arabinoxylan reduces energy intake in an ad libitum meal but does not influence perceptions of appetite and satiety: a randomised control-controlled crossover trial.Eur J Nutr. 2023 Aug;62(5):2205-2215. doi: 10.1007/s00394-023-03136-6. Epub 2023 Apr 12. Eur J Nutr. 2023. PMID: 37046122 Clinical Trial.
References
Publication types
MeSH terms
Substances
LinkOut - more resources
Full Text Sources
Other Literature Sources
Medical
