. 2015 Mar 20;22(9):744-59.
doi: 10.1089/ars.2014.6142. Epub 2015 Feb 10.

Inability to maintain GSH pool in G6PD-deficient red cells causes futile AMPK activation and irreversible metabolic disturbance

Affiliations

Inability to maintain GSH pool in G6PD-deficient red cells causes futile AMPK activation and irreversible metabolic disturbance

Hsiang-Yu Tang et al. Antioxid Redox Signal. .

Abstract

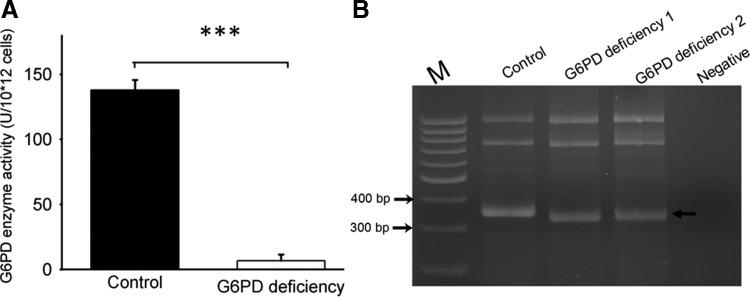
Aims: Glucose 6-phosphate dehydrogenase (G6PD) is essential for maintenance of nicotinamide dinucleotide hydrogen phosphate (NADPH) levels and redox homeostasis. A number of drugs, such as antimalarial drugs, act to induce reactive oxygen species and hemolytic crisis in G6PD-deficient patients. We used diamide (DIA) to mimic drug-induced oxidative stress and studied how these drugs affect cellular metabolism using a metabolomic approach.

Results: There are a few differences in metabolome between red blood cells (RBCs) from normal and G6PD-deficient individuals. DIA causes modest changes in normal RBC metabolism. In contrast, there are significant changes in various biochemical pathways, namely glutathione (GSH) metabolism, purine metabolism, and glycolysis, in G6PD-deficient cells. GSH depletion is concomitant with a shift in energy metabolism. Adenosine monophosphate (AMP) and adenosine diphosphate (ADP) accumulation activates AMP protein kinase (AMPK) and increases entry of glucose into glycolysis. However, inhibition of pyruvate kinase (PK) reduces the efficacy of energy production. Metabolic changes and protein oxidation occurs to a greater extent in G6PD-deficient RBCs than in normal cells, leading to severe irreversible loss of deformability of the former.

Innovation and conclusion: Normal and G6PD-deficient RBCs differ in their responses to oxidants. Normal cells have adequate NADPH regeneration for maintenance of GSH pool. In contrast, G6PD-deficient cells are unable to regenerate enough NADPH under a stressful situation, and switch to biosynthetic pathway for GSH supply. Rapid GSH exhaustion causes energy crisis and futile AMPK activation. Our findings suggest that drug-induced oxidative stress differentially affects metabolism and metabolite signaling in normal and G6PD-deficient cells. It also provides an insight into the pathophysiology of acute hemolytic anemia in G6PD-deficient patients.


Figures

<b>FIG. 1.</b>
FIG. 1.
G6PD activity and PCR-RFLP assay for the G6PD variant. (A) G6PD activity in G6PD-deficient whole blood (n=11) and control whole blood (n=11). Data were shown as mean±SD, ***p<0.001. (B) PCR-RFLP assay for G6PD variants after extraction of DNA from whole blood of normal and G6PD-deficient individuals. The PCR-RFLP assay was performed in normal controls showing a 345 bp band after XhoI digestion, and in two typical G6PD-deficient individuals with the 1376 point mutation showing a 324 bp band (arrow) after XhoI digestion. G6PD, glucose 6-phosphate dehydrogenase; PCR-RFLP, polymerase chain reaction–restriction fragment length polymorphism.
<b>FIG. 2.</b>
FIG. 2.
Enhanced susceptibility of G6PD-deficient RBCs to DIA-induced oxidative damage. RBCs from normal and G6PD-deficient individuals were treated with or without 1 mM DIA. (A) Membrane proteins were extracted and treated without (upper panel) or with (lower panel) DTT for SDS-PAGE analysis and coomassie brilliant blue staining. (B) RBCs lysate were prepared for Western blotting with anti-GSH antibody. A representative experiment out of three is shown here. DIA, diamide; DTT, dithiothreitol; RBCs, red blood cells; SDS-PAGE, sodium dodecyl sulfate-polyacrylamide gel electrophoresis.
<b>FIG. 3.</b>
FIG. 3.
Osmotic deformability profile of RBCs under various incubation conditions. The curves shown in (A) normal and (B) G6PD-deficient RBCs are samples analyzed before and after 30 and 120 min of incubation with 1 mM DIA. (C) The changes in RBC deformability induced by 1 mM DIA treatment were measured in a time-dependent manner with the Rheoscan-D at 3 Pa of shear stress (n=5 per group, mean±SD). Statistical differences were determined by Student's t-test; *p<0.05. (D) The protective effect of 2.5 mM and 5 mM of NAC pretreatment on the change in deformability of G6PD-deficient RBCs treated with 1 mM DIA (n=5 per group, mean±SD).
<b>FIG. 4.</b>
FIG. 4.
Changes in metabolome of G6PD-deficient and control RBCs on DIA challenge. RBCs from normal and G6PD-deficient individuals were incubated with or without 1 mM DIA, and lysates were analyzed by LC-TOF-MS in electrospray positive ion mode. (A) Data were subject to principal component analysis, and the score plot for normal (red) and G6PD-deficient (blue) individuals that were treated with DIA (normal RBC: yellow, G6PD-deficient RBC: cyan) were shown (n=5 per group). (B) Metabolites were ranked according to their VIP scores. Twenty-five most important metabolites contributed significantly to group difference as shown. A higher VIP score (x-axis) indicates a greater contribution to the difference in metabolic profiles between DIA-treated normal and G6PD-deficient RBCs. (C) Pathway analysis of datasets reveals the pathways that were significantly altered in DIA-treated G6PD-deficient cells. This metabolome view shows all metabolic pathways ranked according to scores from pathways enrichment analysis (x-axis) and from pathway topology analysis (y-axis). VIP, variable importance in the projection.
<b>FIG. 5.</b>
FIG. 5.
Differential effect of DIA on GSH metabolic pathways in normal and G6PD-deficient RBCs. Normal and G6PD-deficient RBCs were treated with 1 mM DIA for 0, 0.5, 1, 2, and 3 h, and analyzed for their metabolite profiles. Metabolites were analyzed by LC-MS, and were mapped onto the GSH metabolic pathways. The levels of metabolites are expressed relative to those in untreated normal cells (n=5 per group, mean±SE). Statistical differences between DIA-treated normal and G6PD-deficient cells were determined by ANOVA with Tukey's post hoc test; *p<0.05.
<b>FIG. 6.</b>
FIG. 6.
Differential effect of DIA on purine metabolic pathways in normal and G6PD-deficient RBCs. Normal and G6PD-deficient RBCs were treated with 1 mM DIA for 0, 0.5, 1, 2, and 3 h, and analyzed for their metabolite profiles. Metabolites were analyzed by LC-MS, and were mapped onto the purine metabolic pathways. The levels of metabolites are expressed relative to those in untreated normal cells (n=5 per group, mean±SE). Statistical differences between DIA-treated normal and G6PD-deficient cells were determined by ANOVA with Tukey's post hoc test; *p<0.05.
<b>FIG. 7.</b>
FIG. 7.
Measurement of glycolytic and pentose phosphate pathway metabolites in RBCs on DIA treatment. Normal and G6PD-deficient RBCs were treated with 1 mM DIA for 0 h, 0.5 h, 1 h, 2 h, and 3 h, and were analyzed by LC-MS/MS. (A) A schematic diagram of glycolysis and pentose phosphate pathway that were analyzed by LC-MS/MS. Levels of metabolites in pentose phosphate pathway (B) and glycolytic pathway (C) in DIA-treated RBCs were determined, and are expressed relative to those in untreated normal cells (n=5 per group, mean±SE). Statistical differences between DIA-treated normal and G6PD-deficient cells were determined by ANOVA with Tukey's post hoc test; *p<0.05.
<b>FIG. 8.</b>
FIG. 8.
Activation of AMPK in DIA-treated G6PD-deficient RBCs. Normal and G6PD-deficent RBCs were treated with 1 mM DIA for indicated times. (A) Levels of AMPKα and p-AMPKα (phosphorylated AMPKα) were analyzed by Western blotting and quantified by densitometric scanning. (B) Level of p-AMPKα were normalized to that of total AMPKα. Data are shown as the mean±SE (n=5 per group). Statistical differences between DIA-treated normal and G6PD-deficient cells were determined by Student's t-test; *p<0.05. AMPK, adenosine monophosphate protein kinase.
<b>FIG. 9.</b>
FIG. 9.
Inactivation of PK in DIA-treated G6PD-deficient RBCs. Control and G6PD-deficient RBCs were treated with 1 mM DIA for various time periods and extracted. PK activity in resulting hemolysate was assayed. Error bars represent SE (n=4 per group). Statistical differences were determined by Student's t-test; *p<0.05. PK, pyruvate kinase.
<b>FIG. 10.</b>
FIG. 10.
A schematic diagram illustrating how DIA differentially affects metabolism in normal and G6PD-deficient RBCs. Control RBCs are able to produce enough NADPH for regeneration of GSH via GR. Pentose phosphate pathway is up-regulated, and other metabolic pathways are perturbed to a lesser extent (left). G6PD-deficient cells are impaired in their ability to produce NADPH and to regenerate GSH (right). The de novo GSH synthesis is significantly elevated, but is probably limited by cysteine availability. Methionine cycle is enhanced, reflecting desperate effort of RBCs to synthesize GSH. Ophthalmate is synthesized as a side product. All these events lead to gradual ATP depletion, and ADP and AMP accumulation. AMPK is activated, and increases glucose utilization via glycolysis. Apparently, PK is partially inhibited under oxidative stress. Metabolites marked in red (blue) ink refer to those of a higher (lower) level in G6PD-deficient RBCs than in normal cells. Broken lines indicate the normal metabolic pathways that are blocked or reduced, and bold lines indicate enhanced metabolic pathway. ADP, adenosine diphosphate; AMP, adenosine monophosphate; GR, glutathione reductase; NADPH, nicotinamide dinucleotide hydrogen phosphate.

References

    1. Agarwal KC, Miech RP, and Parks RE., Jr.Guanylate kinases from human erythrocytes, hog brain, and rat liver. Methods Enzymol 51: 483–490, 1978 - PubMed
    1. Anastasiou D, Poulogiannis G, Asara JM, Boxer MB, Jiang JK, Shen M, Bellinger G, Sasaki AT, Locasale JW, Auld DS, Thomas CJ, Vander Heiden MG, and Cantley LC. Inhibition of pyruvate kinase M2 by reactive oxygen species contributes to cellular antioxidant responses. Science 334: 1278–1283, 2011 - PMC - PubMed
    1. Auth T, Safran SA, and Gov NS. Fluctuations of coupled fluid and solid membranes with application to red blood cells. Phys Rev E Stat Nonlin Soft Matter Phys 76: 051910, 2007 - PubMed
    1. Ballatori N. and Dutczak WJ. Identification and characterization of high and low affinity transport systems for reduced glutathione in liver cell canalicular membranes. J Biol Chem 269: 19731–19737, 1994 - PubMed
    1. Barnes K, Ingram JC, Porras OH, Barros LF, Hudson ER, Fryer LG, Foufelle F, Carling D, Hardie DG, and Baldwin SA. Activation of GLUT1 by metabolic and osmotic stress: potential involvement of AMP-activated protein kinase (AMPK). J Cell Sci 115: 2433–2442, 2002 - PubMed

Publication types

MeSH terms

LinkOut - more resources