

Sorafenib inhibits proliferation and invasion of human hepatocellular carcinoma cells via up-regulation of p53 and suppressing FoxM1
- PMID: 25557114
- PMCID: PMC4326788
- DOI: 10.1038/aps.2014.122
Sorafenib inhibits proliferation and invasion of human hepatocellular carcinoma cells via up-regulation of p53 and suppressing FoxM1
Abstract
Aim: Forkhead box M1 (FoxM1) is a transcription factor that plays important roles in the pathogenesis and progression of human cancers, including hepatocellular carcinoma (HCC). The aim of this study was to examine the involvement of FoxM1 in the anti-cancer action of sorafenib, a multikinase inhibitor, in human HCC cells.
Methods: HCC cell lines HepG2 and HuH-7 were tested. Cell viability was examined using MTT assay and cell invasion was determined with Transwell migration assay. The relevant mRNA expression was determined with RT-PCR, and the proteins were detected using Western blotting and immunofluorescence assays. RNA interference was used to modify the expression of p53 and FoxM1. HuH-7 cell line xenograft mice were used for in vivo study, which were treated with sorafenib (40 mg/kg, po) daily for 3 weeks.
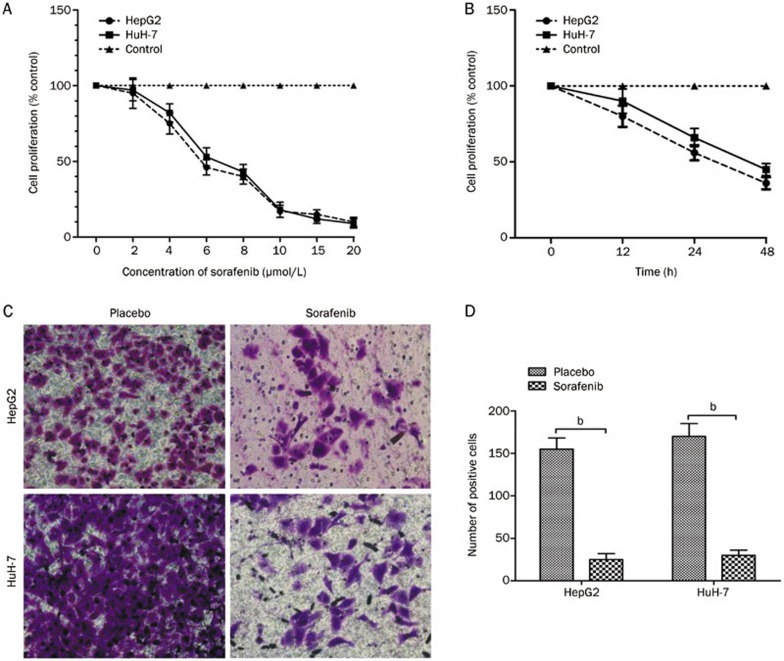
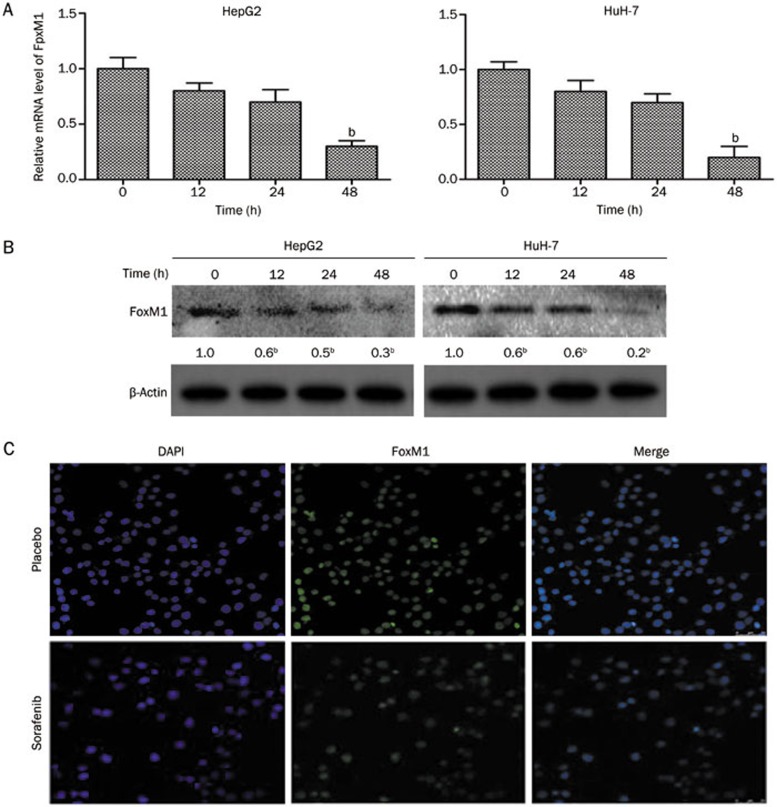
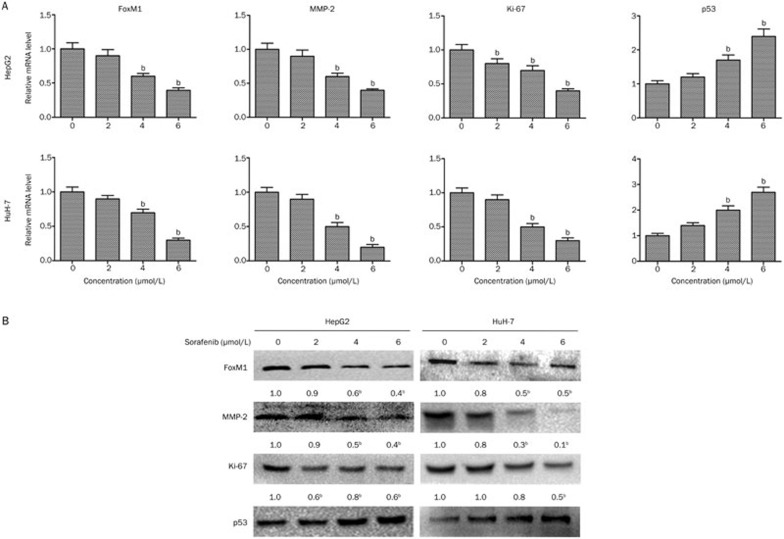
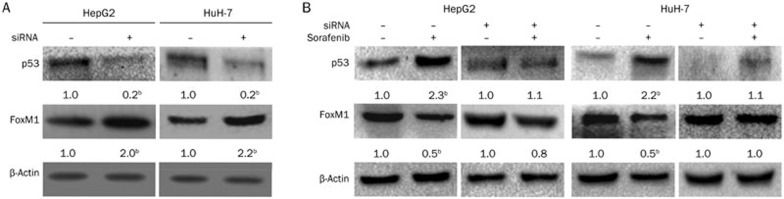
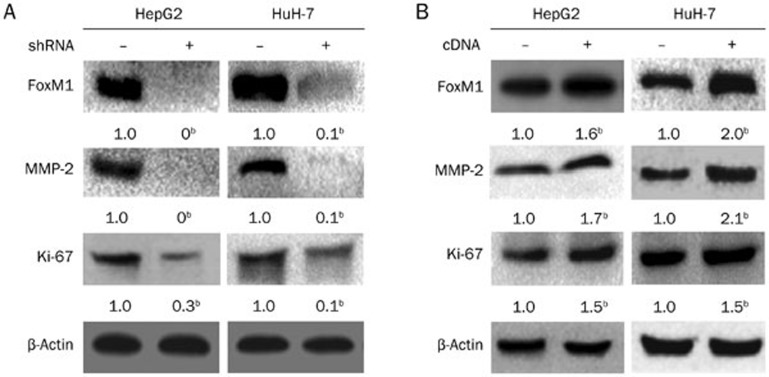
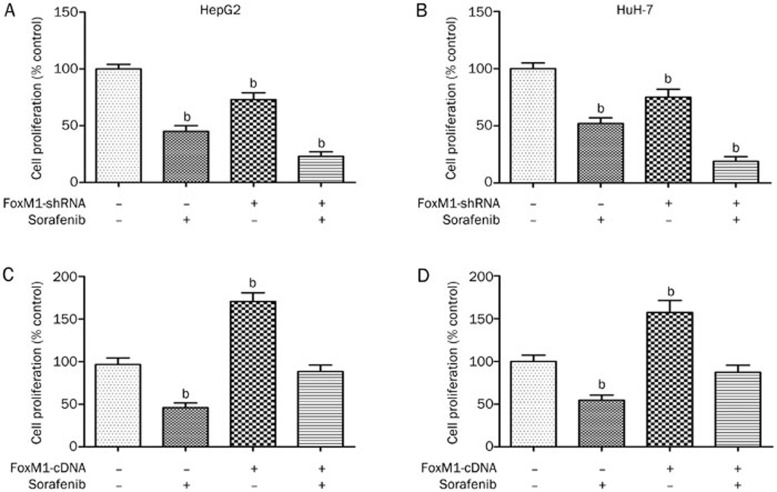
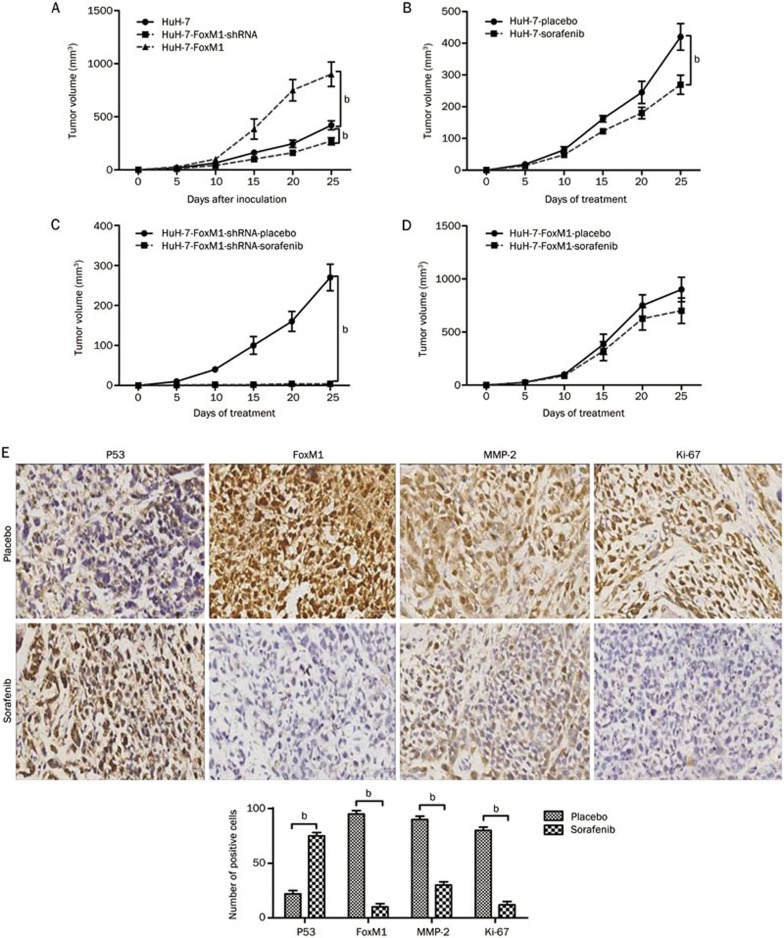
Results: Sorafenib (2-20 μmol/L) inhibited the proliferation of the cells in dose- and time-dependent manners with an IC50 value of nearly 6 μmol/L at 48 h. Sorafenib (6 μmol/L) markedly suppressed the cell invasion. Furthermore, sorafenib (2-6 μmol/L) dose-dependently decreased the expression of FoxM1, MMP-2, and Ki-67, and up-regulated that of p53 in the cells. Silencing p53 abolished the decrease of FoxM1 and increase of p53 in sorafenib-treated cells. Silencing FoxM1 significantly reduced the expression of MMP-2 and Ki-67, and enhanced the anti-proliferation action of sorafenib in the cells, whereas overexpression of FoxM1 increased the expression of MMP-2 and Ki-67, and abrogated the anti-proliferation action of sorafenib. In the xenograft mice, sorafenib administration decreased the tumor growth by 40%, and markedly increased the expression of p53, and decreased the expression of FoxM1, MMP-2, and Ki-67 in tumor tissues.
Conclusion: Sorafenib inhibits HCC proliferation and invasion by inhibiting MMP-2 and Ki-67 expression due to up-regulation of P53 and suppressing FoxM1.
Figures
Similar articles
-
Sorafenib suppresses the epithelial-mesenchymal transition of hepatocellular carcinoma cells after insufficient radiofrequency ablation.BMC Cancer. 2015 Nov 30;15:939. doi: 10.1186/s12885-015-1949-7. BMC Cancer. 2015. PMID: 26620566 Free PMC article.
-
Cyclin E1 Inhibition can Overcome Sorafenib Resistance in Hepatocellular Carcinoma Cells Through Mcl-1 Suppression.Clin Cancer Res. 2016 May 15;22(10):2555-64. doi: 10.1158/1078-0432.CCR-15-0499. Epub 2015 Nov 24. Clin Cancer Res. 2016. PMID: 26603262
-
FoxM1 overexpression promotes epithelial-mesenchymal transition and metastasis of hepatocellular carcinoma.World J Gastroenterol. 2015 Jan 7;21(1):196-213. doi: 10.3748/wjg.v21.i1.196. World J Gastroenterol. 2015. PMID: 25574092 Free PMC article.
-
FOXM1 in sarcoma: role in cell cycle, pluripotency genes and stem cell pathways.Oncotarget. 2016 Jul 5;7(27):42792-42804. doi: 10.18632/oncotarget.8669. Oncotarget. 2016. PMID: 27074562 Free PMC article. Review.
-
Prognostic Value of FOXM1 in Patients with Malignant Solid Tumor: A Meta-Analysis and System Review.Dis Markers. 2015;2015:352478. doi: 10.1155/2015/352478. Epub 2015 Jul 22. Dis Markers. 2015. PMID: 26451068 Free PMC article. Review.
Cited by
-
Overexpression of MFN2 alleviates sorafenib-induced cardiomyocyte necroptosis via the MAM-CaMKIIδ pathway in vitro and in vivo.Theranostics. 2022 Jan 1;12(3):1267-1285. doi: 10.7150/thno.65716. eCollection 2022. Theranostics. 2022. PMID: 35154486 Free PMC article.
-
The oncogenic role of FOXM1 in hepatocellular carcinoma: molecular mechanisms, clinical significance, and therapeutic potentials.Naunyn Schmiedebergs Arch Pharmacol. 2025 Apr 23. doi: 10.1007/s00210-025-04144-5. Online ahead of print. Naunyn Schmiedebergs Arch Pharmacol. 2025. PMID: 40266300 Review.
-
A Novel Aurora-A Inhibitor (MLN8237) Synergistically Enhances the Antitumor Activity of Sorafenib in Hepatocellular Carcinoma.Mol Ther Nucleic Acids. 2018 Dec 7;13:176-188. doi: 10.1016/j.omtn.2018.08.014. Epub 2018 Sep 12. Mol Ther Nucleic Acids. 2018. PMID: 30292139 Free PMC article.
-
Differential effectiveness of tyrosine kinase inhibitors in 2D/3D culture according to cell differentiation, p53 status and mitochondrial respiration in liver cancer cells.Cell Death Dis. 2020 May 7;11(5):339. doi: 10.1038/s41419-020-2558-1. Cell Death Dis. 2020. PMID: 32382022 Free PMC article.
-
In silico and cheminformatics prediction with experimental validation of an adipogenesis cocktail, sorafenib with rosiglitazone for HCC dedifferentiation.J Genet Eng Biotechnol. 2024 Dec;22(4):100429. doi: 10.1016/j.jgeb.2024.100429. Epub 2024 Nov 12. J Genet Eng Biotechnol. 2024. PMID: 39674644 Free PMC article.
References
-
- Kim DY, Paik YH, Ahn SH, Youn YJ, Choi JW, Kim JK, et al. PIVKA-II is a useful tumor marker for recurrent hepatocellular carcinoma after surgical resection. Oncology. 2007;72:52–7. - PubMed
-
- Scotto KW, Biedler JL, Melera PW. Amplification and expression of genes associated with multidrug resistance in mammalian cells. Science. 1986;232:751–5. - PubMed
-
- Lang L. FDA approves sorafenib for patients with inoperable Liver Diseases. cancer. Gastroenterology. 2008;134:379. - PubMed
-
- Hahn O, Stadler W. Sorafenib. Curr Opin Oncol. 2006;18:615–21. - PubMed
Publication types
MeSH terms
Substances
LinkOut - more resources
Full Text Sources
Other Literature Sources
Medical
Research Materials
Miscellaneous
