. 2015 Jan;13(1):47-81.
doi: 10.1016/j.jtos.2014.06.003. Epub 2014 Nov 6.

Potentially pathogenic immune cells and networks in apparently healthy lacrimal glands

Affiliations

Potentially pathogenic immune cells and networks in apparently healthy lacrimal glands

Austin K Mircheff et al. Ocul Surf. 2015 Jan.

Abstract

Lacrimal glands of people over 40 years old frequently contain lymphocytic infiltrates. Relationships between histopathological presentation and physiological dysfunction are not straightforward. Data from rabbit studies have suggested that at least two immune cell networks form in healthy lacrimal glands, one responding to environmental dryness, the other to high temperatures. New findings indicate that mRNAs for several chemokines and cytokines are expressed primarily in epithelial cells; certain others are expressed in both epithelial cells and immune cells. Transcript abundances vary substantially across glands from animals that have experienced the same conditions, allowing for correlation analyses, which detect clusters that map to various cell types and to networks of coordinately functioning cells. A core network--expressing mRNAs including IL-1α, IL-6, IL-17A, and IL-10--expands adaptively with exposure to dryness, suppressing IFN-γ, but potentially causing physiological dysfunction. High temperature elicits concurrent increases of mRNAs for prolactin (PRL), CCL21, and IL-18. PRL is associated with crosstalk to IFN-γ, BAFF, and IL-4. The core network reacts to the resulting PRL-BAFF-IL-4 network, creating a profile reminiscent of Sjögren's disease. In a warmer, moderately dry setting, PRL-associated increases of IFN-γ are associated with suppression of IL-10 and augmentations of IL-1α and IL-17, creating a profile reminiscent of severe chronic inflammation.

Keywords: Sjögren's disease(∗); aging; autoimmunity; chronic inflammation; dacryoadenitis; dry eye; prolactin.


Figures

Figure 1
Figure 1
Average daily maximal dryness and high temperature experienced by experimental groups during 30 days before arrival at USC Vivaria. Animals were consistently euthanized and necropsied 4 days after arrival.
Figure 2
Figure 2
Histoarchitectural organization of transcript expression: Relative abundances in acini, intralobular ducts, interlobular ducts, and intralobar ducts. Two V82%,29° glands were microdissected with a laser capture system. Two additional glands from term pregnant animals (P82%,29°) also were microdissected; those data will be reported elsewhere. The intensity of shading in each structure is proportional to the transcript’s highest mean relative abundance. Note that the highest abundances of TGF-β1 were found in periductal/perivenular immune cell accumulations, while the highest abundances of TGF-β2 were found in the three duct segments. The highest abundances of CCL2 were found in acinar cells, and the highest abundances of CCL4 were found in interlobular duct cells. The highest abundances of mRNAs for lipophilin CL and for the mitogenic cytokines, IL-2, APRIL, and PRL also were found in acinar cells, and mRNAs for APRIL and PRL were additionally found in cells of all three duct segments.
Figure 3
Figure 3
Transcript abundances in OS and OD lacrimal glands from V82%,29°. The transcripts that showed the largest OS-OD variations were positively associated with a core adaptive-reactive network. The variability between companion glands emphasizes the importance of stochastic events and positive crosstalk at the level of the individual gland.
Figure 3
Figure 3
Transcript abundances in OS and OD lacrimal glands from V82%,29°. The transcripts that showed the largest OS-OD variations were positively associated with a core adaptive-reactive network. The variability between companion glands emphasizes the importance of stochastic events and positive crosstalk at the level of the individual gland.
Figure 4
Figure 4
Schema depicting the correlation clusters detected and the cell types and networks inferred in glands from V58%,17°. Pearson’s correlation statistics and empirical correlation clusters are presented in Supplemental Table 1. Relationships between the abundances of selected transcripts and the abundances of mRNAs for IL-10 and PRL are presented in Figure 9. Brackets { } indicate transcripts that sorted to correlation clusters and parenthesis ( ) indicate transcripts that were assayed but not found to be significantly associated with other transcripts. Green dots (●) indicate positive associations; red dots (●) indicate negative associations. The large cells at the left represent epithelial cells without distinguishing between the acini and the three duct segments analyzed. CCL4 mRNA was found both in interlobular duct epithelial cells and in immune cell accumulations; whether variations at one site are associated with variations at the other has not been determined. Decorin mRNA was detected in acinar cells and in all ductal segments, but it was most abundant in immune cell accumulations, and, for simplicity, it is shown as being localized to immune cell accumulations. In groups that had been exposed to more dryness and higher temperatures (Figure 5 – Figure 8), mRNAs for IL-1β and IL-2; IL-6; CD8; and IL-1α, CTLA-4, and IL-10; and, in most cases, CCR5 sorted to the same correlation cluster, creating the signature of the core, adaptive-reactive network. Theses transcripts are denoted in bold type.
Figure 5
Figure 5
Schema depicting the correlation clusters detected and the cell types and networks inferred in glands from V61%,27°. Pearson’s correlation statistics are presented in Supplemental Table 2. Relationships between abundances of selected transcript and abundances of mRNAs for CD4 and IL-10 are presented in Figure 10. Details are as described in the legend to Figure 4. The core, adaptive-reactive network developed independently of the TH3-remniscent network, and it generated negative crosstalk to cells—presumably TH1 cells or NKT—that expressed IFN-γ mRNA. TH3-reminiscent network engaged in positive crosstalk with cells—possibly, TH2 cells—that expressed IL-4 mRNA and with cells that expressed mRNAs for CXCL13, Casp1, MMP-9, CCL21, CD3ε, and CD3ζ. The phenomena depicted as emergent were associated with appearance of the frank immunopathological state in gland V61%,27°02.OS. These phenomena might have been triggered either by some adventitious event, such as trauma or infection, or by a stochastic event, such as the coincidence of large numbers of TH2-reminiscent cells and large numbers of cells of the core, adaptive-reactive network giving rise to a new network.
Figure 6
Figure 6
Schema depicting the correlation clusters detected and the cell types and networks inferred in glands from V68%,37°. Pearson’s correlation statistics are presented in Supplemental Table 3. Details are as described in the legend to Figure 4. Associations between the abundances of mRNAs for PRL, IFN-γ, IL-4, and BAFF are shown in Figure 12.A. Epithelial cells expressing PRL mRNA engaged in positive crosstalk with TH1- reminiscent cells expressing IFN-γ and with TH2-reminicent cells expressing IL-4. They also engaged in negative crosstalk with TH3-reminiscent cells. Negative crosstalk between IL-4-expressing cells and BAFF-expressing cells was abrogated at higher levels of PRL expression, and negative crosstalk between IL-4 expressing cells and IFN-γ-expressing cells emerged at the highest level of PRL expression. The core, adaptive-reactive network initially developed independently of the interplay between cells expressing mRNAs for PRL, IL-4, BAFF, and IFN-γ. The emergent phenomena depicted represent the state in gland V68%,37°02.OS, associated with positive crosstalk between the core, adaptive-reactive network; cells expressing PRL, BAFF, and IL-4; and cells expressing CCL2 and CCL4. These interactions played out in a local setting of concurrently high levels of IL-18 mRNA expression and high levels of CCL21 mRNA expression. With the exception of negative crosstalk between cells expressing CCL21 and cells expressing CXCL13, the resulting transcript expression profile is reminiscent of Sjögren’s ectopic immune inductive tissue. The state that emerged in gland V68%,37°03.OS (not shown) may have been associated with the appearance of and additional source of IL-10 mRNA expression (Figure 12.B).
Figure 7
Figure 7
Schema depicting the cell types and networks inferred in glands from V72%,32°, based on Pearson’s correlation statistics presented in Supplemental Tables 4 - 6; certain associations that were significant across the entire sample of glands (Supplemental Table 6) are omitted to simplify depiction of the emergent phenomena. Associations between the abundance of IFN-γ mRNA and the abundances of mRNAs for IL-10 and PRL are shown in Figure 13.A. Relationships between the abundances of additional transcripts and the abundances of mRNAs for IL-10 and IFN γ are shown in Figure 14. Details are as described in the legend to Figure 4. The findings presented in Figure 13.A suggest that a critical feature of the initial state was positive crosstalk between epithelial cells expressing PRL mRNA and cells—presumably TH1 cells or NKT cells—expressing IFN-γ mRNA. Rather than abrogating this crosstalk, TH3-reminiscent cells expressing TGF-β2 accumulated coordinately. Emergence of the second state may have depended on abrogation of the PRL mRNA - IFN-γ crosstalk by increasing levels of IL-10 expression, associated with ongoing development of the core, adaptive-reactive network. Emergence of a third state, in gland V72%,32°01.OD, was characterized by disproportionately large increases in the expression of IL-17A, IL-10, CD8, and CD28. As can be seen in Supplemental Figure 1, all three states are characterized by relatively low levels of IL-10 expression and relatively high levels of IL-1α and IL-17A expression.
Figure 8
Figure 8
Schema depicting the correlation clusters detected and the cell types and networks inferred in glands from V82%,29°. Pearson’s correlation statistics are presented in Supplemental Table 7. The abundance of IFN-γ mRNA ( formula image
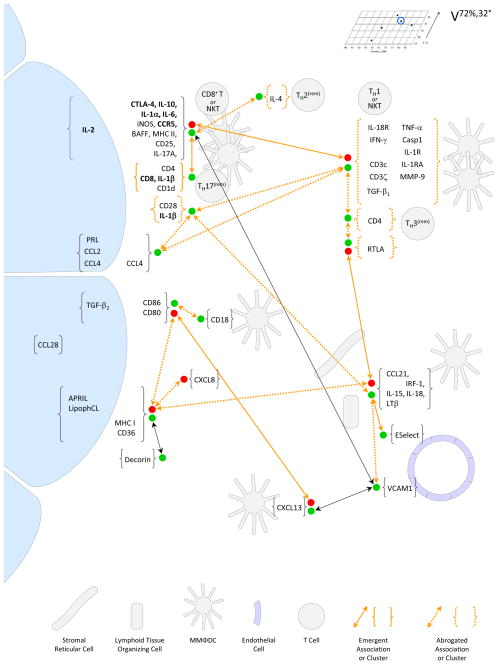
) was below the limit of detection. Details are as described in the legend to Figure 4. Development of the core, reactive-adaptive network was associated with positive crosstalk to TH2-reminiscent cells, which expressed IL-4; with positive crosstalk to cells that expressed CCL21; and, indirectly, with positive crosstalk to cells that expressed CXCL13. As shown in Figure 11, none of the glands presented with frank immunopathology, but as discussed in Section III, increasing levels of iNOS, IL-1, and IL-6 may come to be associated with physiological dysfunction.
Figure 9
Figure 9
Relationships between abundances of selected transcripts and abundances of mRNAs for IL-10 and PRL in glands from V. G4. Significant associations with IL-10 mRNA are projected onto the back walls. Significant associations with PRL mRNA are projected onto the left side walls.
Figure 10
Figure 10
Relationships between abundances of selected transcripts and abundances of mRNAs for CD4 and IL-10 in glands from V61%,27°. Values for gland V61%,27°02.OS ( formula image) were omitted from the initial regression analyses to minimize both type 1 and type 2 errors. Solid lines indicate range of X-axis values over which regressions were calculated, and dashed lines indicate projections. A. Associations with CD4 mRNA. The number of T cells (RTLA+ cells) and the abundance of CCL21 mRNA increased in approximately constant proportions across the entire sample of glands. Exponential regressions of IL-4 and MMP-9 mRNA abundances across the first five glands fell short of the P <.05 criterion for statistical significance. However, projections of both predicted values in gland V61%,27°01.OS that were near the observed values, and regressions calculated across all six glands were highly significant (dotted lines). B. Lack of a significant association between the abundances of mRNAs for CD4 and IL-10 across the first five V61%,27° glands. C. Associations with IL-10 mRNA. With the exception of CCR5 mRNA, the abundances of core, adaptive-reactive network transcripts in gland V61%,27°02.OS fell within two standard errors of the proportions in the other V61%,27° glands. This finding suggests that the network remained intact as it reacted to positive crosstalk associated with the immunopathological process. Abundances of mRNAs for CCL4, CCL2, CD25, CD28, BAFF, and numbers of bone marrow-derived cells—marked by CD18—were not significantly associated with the core, adaptive-reactive network transcripts across the first five glands but were significantly increased in gland V61%,27°02.OS.
Figure 11
Figure 11
Representative sections of V72%,32° glands stained for RTLA and CD18. Images of similarly stained sections of V58%,17°, V61%,27°, V68%,37°, and V82%,29° glands have been presented elsewhere. Immunopathological lesions are not evident in any gland, and gland V72%,32°01.OD, which had higher abundances of numerous transcripts, had fewer than the median number of CD18+ cells and the fewest RTLA+ cells.
Figure 12
Figure 12
Relationships between abundances of selected transcripts and abundances of mRNAs for PRL and IL-10 in glands from V68%,37°. A. PRL mRNA. The regression of IFN-γ mRNA abundances calculated across the first four glands fell short of the P < .05 criterion, but the projection for gland V68%,37°02.OS (⊗) was nearly identical to the observed value. The regression calculated through gland V68%,37°02.OS was highly significant (dotted line). The regression of BAFF mRNA abundances calculated across all six glands was significant, but it obscures a significant negative association (ρ = −0.961, P = .0386) between the abundance of BAFF mRNA and the abundance of IL-4 mRNA across the first four glands. B. IL-10 mRNA. Abundances in glands V68%,37°02.OS and V68%,37°03.OS (⊕) were omitted from the regression analyses to minimize type 1 and type 2 errors. Values for gland V68%,37°02.OS projected by regressions calculated over the first four glands were similar to the observed values for mRNAs for IL-1α, CTLA-4, CD8, and IL-6.
Figure 13
Figure 13
Relationships between the abundances of IFN-γ mRNA and the abundances of mRNAs for IL-10 and PRL in glands from groups V61%,27° and V72%,32°. Dark areas in projections onto rear and side walls indicate ranges of IL-10 mRNA abundances and IFN-g mRNA abundances over which regressions were calculated. A. Group V72%,32°. The abundance of PRL mRNA was significantly related to the abundance of IL-10 mRNA across the first nine glands. The abundance of IFN-γ mRNA increased with increasing abundance of PRL mRNA across the first four glands and decreased with increasing abundance of IL-10 mRNA across the next five glands. B. Group V61%,27°. The abundance of IFN-γ mRNA decreased with increasing abundance of IL-10 mRNA across the first five glands. The value the regression projected for gland V61%,27°02.OS was similar to the observed value.
Figure 14
Figure 14
Relationships between the abundances of selected transcripts and the abundances of mRNAs for IL-10 and IFN-γ in glands from group V72%,32°. Increasing abundances of IFN-γ mRNA across the first four glands were associated with increases in the abundances of mRNAs for IL-18R, TNF-α, IL-1RA, CD3ε, CD3ζ, CCL4, and CCL2 and with increases in the number of T cells, marked by RTLA. Increasing abundances of IL-10 mRNA across the next five glands were consistent with increasing abundances of core, adaptive-reactive network transcripts, e.g., CD8 mRNA and associations with the abundances of mRNAs for iNOS, CD1d, and IL-17A, as well as with mRNAs for CD4,CD25, MHC II, IL-4, and BAFF. Abundances of transcripts in gland V72%,32°01.OD were omitted from the regression analyses to reduce the possibility of type 1 or type 2 errors. Like the abundance of IFN-γ mRNA (Figure 13.A), the abundance of IL-17A mRNA in gland V72%,32°01.OD, was considerably higher than projected by the linear regressions; this conclusion was confirmed by projections of multiple linear regressions. It may be noted that IL-17A mRNA abundances with gland V72%,32°01.OD included are strongly and significantly described by three-parameter exponential growth regression. According to such a model, the high abundance of IL-17A mRNA in gland V72%,32°01.OD would be a predictable development, rather than an emergent phenomenon.
Figure 15
Figure 15
Relationships between abundances of selected transcripts and environmental dryness and high temperature. Median abundances and abundances in individual glands that appeared as outliers are presented. A. Abundances of transcript that could be described as changing with increasing exposure to dryness. B. Abundances of transcripts that could be described as changing with exposure to increasing temperature. Continuous surfaces represent the domains over which median abundances could be described as conforming to empirical exponential growth curves or heuristics. Discontinuities represent domains in which surfaces could not be projected because median abundances in one or more groups were augmented above or displaced below the values predicted by their respective heuristics. Smaller font indicates transcripts that behaved similarly to the plotted transcripts.
Figure 15
Figure 15
Relationships between abundances of selected transcripts and environmental dryness and high temperature. Median abundances and abundances in individual glands that appeared as outliers are presented. A. Abundances of transcript that could be described as changing with increasing exposure to dryness. B. Abundances of transcripts that could be described as changing with exposure to increasing temperature. Continuous surfaces represent the domains over which median abundances could be described as conforming to empirical exponential growth curves or heuristics. Discontinuities represent domains in which surfaces could not be projected because median abundances in one or more groups were augmented above or displaced below the values predicted by their respective heuristics. Smaller font indicates transcripts that behaved similarly to the plotted transcripts.
Figure 16
Figure 16
Theoretical projections of IL-6 mRNA abundance changes over time. (A) Projections of median abundances at the values of Δ%H¯ experienced by each of the five groups. (B) Projections of the abundances in the individual V82%,29°.OS glands at the value of Δ%H¯ that the V82%,29° animals had experienced. The projections assumed that values of [mRNA]0 had varied stochastically among the individual glands and the value of b30d remained constant.

Similar articles

Cited by

References

    1. Sjögren H, Bloch KJ. Keratoconjunctivitis sicca and Sjögren’s syndrome. Surv Ophthalmol. 1971;16:145–59.
    1. Sato EA, Matsumoto Y, Dogru M, et al. Lacrimal gland in Sjögren’s syndrome. Ophthalmology. 2010;117:1055–1055. e3. - PubMed
    1. Ogawa Y, Kuwana M. Dry eye as a major complication associated with chronic graft-versus-host disease after hematopoietic stem cell transplantation. Cornea. 2003;22 (Suppl 1):S19–27. - PubMed
    1. Yanardag H, Pamuk ÖN. Lacrimal gland involvement in sarcoidosis. Swiss Med Wkly. 2003;133:388–91. - PubMed
    1. Hunter DG, Foster CS. Ocular manifestations of sarcoidosis. In: Albert DM, Jakobiec FA, editors. Principles and Practice of Ophthalmology. Philadelphia: WB Saunders; 1994. pp. 443–50.

Publication types