. 2015 Jan 5:6:5928.
doi: 10.1038/ncomms6928.

AtPHT4;4 is a chloroplast-localized ascorbate transporter in Arabidopsis

Affiliations

AtPHT4;4 is a chloroplast-localized ascorbate transporter in Arabidopsis

Takaaki Miyaji et al. Nat Commun. .

Abstract

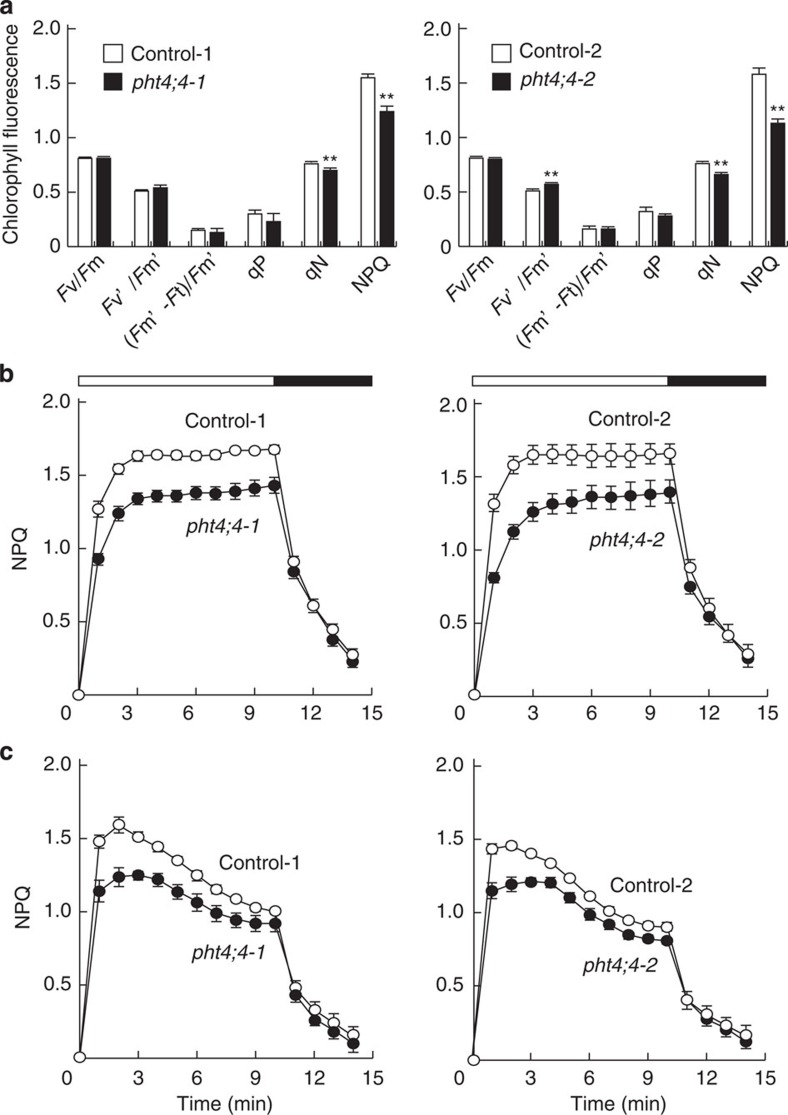
Ascorbate is an antioxidant and coenzyme for various metabolic reactions in vivo. In plant chloroplasts, high ascorbate levels are required to overcome photoinhibition caused by strong light. However, ascorbate is synthesized in the mitochondria and the molecular mechanisms underlying ascorbate transport into chloroplasts are unknown. Here we show that AtPHT4;4, a member of the phosphate transporter 4 family of Arabidopsis thaliana, functions as an ascorbate transporter. In vitro analysis shows that proteoliposomes containing the purified AtPHT4;4 protein exhibit membrane potential- and Cl(-)-dependent ascorbate uptake. The AtPHT4;4 protein is abundantly expressed in the chloroplast envelope membrane. Knockout of AtPHT4;4 results in decreased levels of the reduced form of ascorbate in the leaves and the heat dissipation process of excessive energy during photosynthesis is compromised. Taken together, these observations indicate that the AtPHT4;4 protein is an ascorbate transporter at the chloroplast envelope membrane, which may be required for tolerance to strong light stress.


Figures

Figure 1
Figure 1. Phylogenetic tree of the plant SLC17 transporter family and ascorbate transporter of Arabidopsis SLC17 transporter family.
(a) Phylogenetic tree of the plant SLC17 transporter family. Arabidopsis SLC17 transporters are indicated in red boxes. (b) Purification of Arabidopsis SLC17 transporter family. (Left) The purified fraction (10 μg) was analysed by 10% SDS-PAGE and visualized by CBB staining. (Right) A duplicate gel was analysed by immunoblotting with anti-6 × His antibody. The positions of marker proteins are indicated on the left. The positions of recombinant proteins are indicated by arrowheads. (c) Na+/Pi uptake by proteoliposomes containing purified AtPHT4 proteins at 2 min. ΔNa+-driven Pi uptake by proteoliposomes was assayed in the presence (closed bars) or absence (open bars) of Na+. (d) Ascorbate uptake by the proteoliposomes at 2 min. Δψ-driven ascorbate uptake by proteoliposomes was assayed in the presence (closed bars) or absence (open bars) of 2 μM valinomycin. Data are means±s.e., n=3–6.
Figure 2
Figure 2. Characterization of ascorbate transport by AtPHT4;4.
Proteoliposomes containing purified AtPHT4;4 were prepared, and ascorbate uptake was initiated by addition of 2 μM valinomycin. (a) Time course of proteoliposomes containing AtPHT4;4 in the presence (closed circles) or absence (open circles) of valinomycin, or no AtPHT4;4 in the presence of valinomycin (open triangles). (b) Dose dependence. The Δψ-dependent ascorbate uptake at 1 min was determined at various ascorbate concentrations. A Lineweaver–Burk plot is shown in the inset. (c) Driving force. Proteoliposomes containing Na+ or K+ were prepared and incubated in buffer containing K+ as indicated. Ascorbate uptake was measured at 2 min after addition of 2 μM valinomycin (Val) or 2 μM nigericin (Nig). For some experiments, proteoliposomes were prepared at pH 7.0 and K+, incubated in buffer at either pH 7.0 and K+, pH 5.6 and K+, or pH 7.0 and Na+, and assayed after 2 min. (d) Ascorbate uptake at 1 min was assayed in the presence or absence of different concentrations of Cl. (e) The effects of inhibitors of ascorbate uptake at 1 min. The effects of Evans blue and 4,4′-diisothiocyano-2,2′-stilbenedisulphonic acid (DIDS), at 1 and 10 μM, were examined. (f) cis-Inhibition of ascorbate uptake at 1 min. AtPHT4;4-mediated uptake of 100 μM ascorbate was measured in the absence or presence of the listed compounds. Data are means±s.e., n=3–4.
Figure 3
Figure 3. Expression of AtPHT4;4 protein and its association with the chloroplast envelope.
(a) Immunological specificity of anti-AtPHT4;4 antibody. (Left) In a parallel experiment to that shown in Fig. 1b, immunoblotting analysis with anti-AtPHT4;4 was conducted. (Right) Preabsorbed antibodies were used as controls. The positions of marker proteins are indicated on the left. The position of AtPHT4;4 protein is indicated by an arrow. (b) Immunohistochemical localization of AtPHT4;4 in leaves. The fluorescence signals of AtPHT4;4 and chlorophyll are shown in green and magenta, respectively. Bar=20 μm. (c) (Upper) Higher magnification view of b (yellow box). (Middle and Lower) Merge of anti-TIC40 (envelope membrane marker) and chlorophyll, and anti-LHC2 (thylakoid membrane marker) and chlorophyll. Bar=20 μm.
Figure 4
Figure 4. Ascorbate content was decreased in the leaves of atpht4;4 mutants.
(a) RT–PCR analysis was performed with total RNA isolated from leaves of control plants (Control-1 and Control-2) and mutants (pht4;4-1 and pht4;4-2) using primers specific for AtPHT4;4 and AtActin2 mRNAs. (b) Immunoblotting was performed with crude membranes (50 μg) of chloroplasts prepared from four Arabidopsis lines using antibodies specific to AtPHT4;4 and LHC2 proteins. (c) Immunohistochemical expression of AtPHT4;4 in the leaves of four Arabidopsis lines. The fluorescent signals of AtPHT4;4 and chlorophyll are shown in green and magenta, respectively. Bar=20 μm. (d) Growth of the four Arabidopsis lines. Plants were grown under low-light conditions with a 16-h light/8-h dark cycle. Plants were photographed at the age of 4 weeks. (e) Contents of the reduced and oxidized forms of ascorbate in the leaves of control plants (Control-1 and Control-2, open bars) and mutants (pht4;4-1 and pht4;4-2, closed bars) before (LL) and after (HL) transfer from low-light to high-light conditions (540 μmol photons m−2 s−1) for 2 min following 15-min dark adaptation. Total ascorbate is the sum of reduced and oxidized forms. Data are means±s.e., n=4–6, *P<0.05, Student’s t-test. Chl a, Chlorophyll a.
Figure 5
Figure 5. atpht4;4 mutants showed decreased protection from excess absorbed light energy through thermal dissipation.
(a) Chlorophyll fluorescence was measured in the leaves of control plants (Control-1 and Control-2, open bars) and mutants (pht4;4-1 and pht4;4-2, closed bars) during 2 min of illumination with high light (HL, 540 μmol photons m−2 s−1). (b) NPQ was measured in the leaves of control plants (Control-1 and Control-2, open circles) and mutants (pht4;4-1 and pht4;4-2, closed circles) during 10 min of illumination with HL (540 μmol photons m−2 s−1, open bars), followed by 4 min of darkness (closed bars). (c) NPQ was measured in the leaves of four Arabidopsis lines during 10 min of illumination with HL (230 μmol photons m−2 s−1, open bars), followed by 4 min of darkness (closed bars). Data are means±s.e., n=4, **P<0.01, Student’s t-test.
Figure 6
Figure 6. Pigment contents of wild-type and atpht4;4 mutants.
(a) Schematic model of xanthophyll cycle. Xanthophylls consist of three pigments—violaxanthin, antheraxanthin and zeaxanthin (dotted box). Under high-light conditions, VDE and ascorbate convert violaxanthin at a higher light condensation rate to antheraxanthin and then zeaxanthin at a lower rate with release of excessive light energy by heat dissipation. In contrast, zeaxanthin epoxidase (ZEP) converts zeaxanthin to antheraxanthin and then violaxanthin under low-light condition, leading to an increase in light condensation rate. (b) Pigment measurements in the leaves of wild-type (wild-type1, open bars) and mutants (pht4;4-1, closed bars) were performed before (LL) and after (HL) transfer from low light to high light (540 μmol photons m−2 s−1) for 2 min following 15-min dark adaptation. Control contents (100%) correspond to 13.7, 3.0, 26.4, 104.2, 34.4 and 34.0 mmol per mol Chl a, respectively. Data are means±s.e., n=10–12, *P<0.05, **P<0.01, Student’s t-test. Chl a, Chlorophyll a.
Figure 7
Figure 7. Schematic model of ascorbate transport in chloroplasts.
Upon photostress, PHT4;4 gene expression is enhanced, and the PHT4;4 protein at the envelope membranes takes up ascorbate from mitochondria, which is transferred into the thylakoid through an as yet unknown transporter. PHT4;1 is a candidate ascorbate transporter at the thylakoid membrane.

Similar articles

Cited by

References

    1. Englard S. & Seifter S. The biochemical functions of ascorbic acid. Annu. Rev. Nutr. 6, 365–406 (1986). - PubMed
    1. Smirnoff N. & Wheeler G. L. Ascorbic acid in plants: biosynthesis and function. Crit. Rev. Biochem. Mol. Biol. 35, 291–314 (2000). - PubMed
    1. Gallie D. R. The role of L-ascorbic acid recycling in responding to environmental stress and in promoting plant growth. J. Exp. Bot. 64, 433–443 (2013). - PubMed
    1. Smirnoff N. Ascorbate biosynthesis and function in photoprotection. Phil. Trans. R. Soc. Lond. B 355, 1455–1464 (2000). - PMC - PubMed
    1. Zechmann B. Subcellular distribution of ascorbate in plants. Plant Signal. Behav. 6, 360–363 (2011). - PMC - PubMed

Publication types

MeSH terms