Evaluation of inbreeding and genetic variability of five pig breeds in czech republic
- PMID: 25557673
- PMCID: PMC4283186
- DOI: 10.5713/ajas.14.0251
Evaluation of inbreeding and genetic variability of five pig breeds in czech republic
Abstract
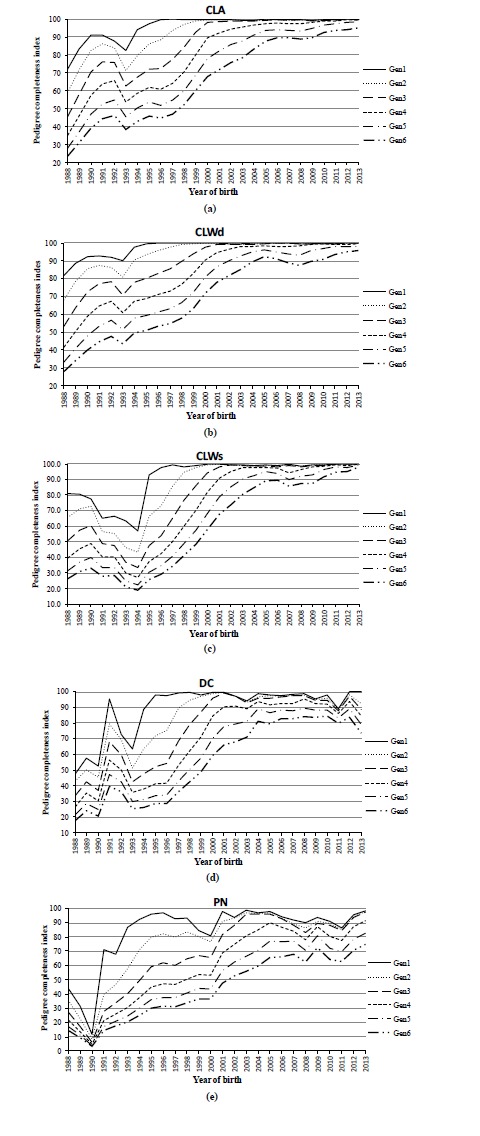
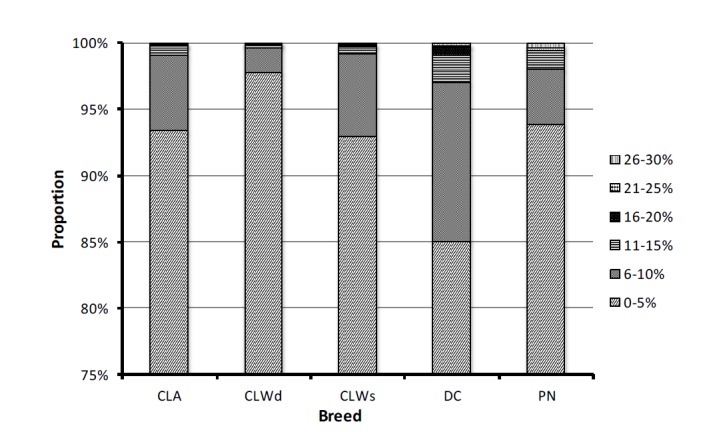
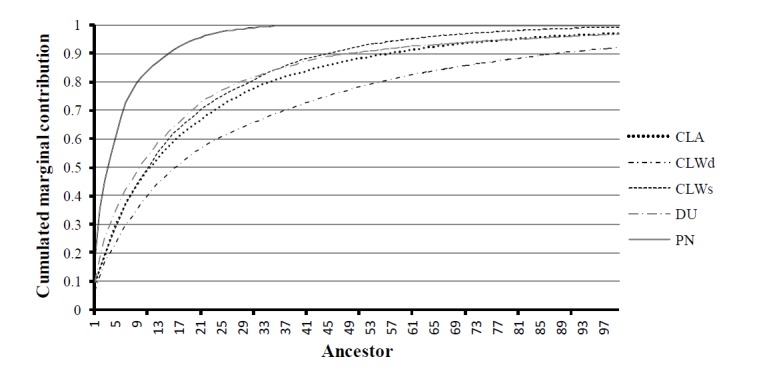
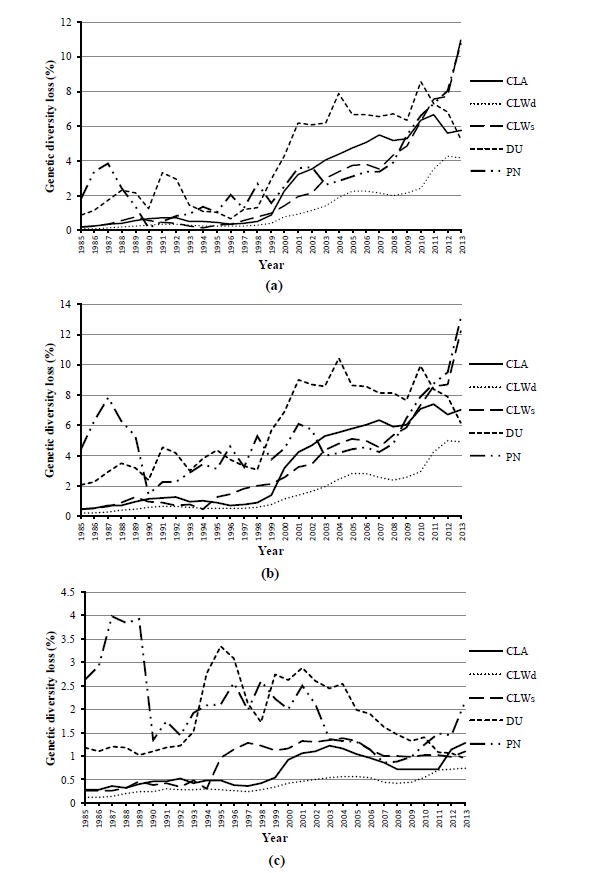
The complex analysis of the pedigree records of Czech Landrace (CLA), Czech Large White-dam line (CLWd), Czech Large White-sire line (CLWs), Duroc (DC), and Pietrain (PN) was performed to determine trends of genetic diversity (GD), and to find the main sources of the GD loss. The total size of the pedigree was 132,365, 391,151, 32,913, 13,299, and 7,160 animals in CLA, CLWd, CLWs, DC, and PN, respectively. Animals born in the years 2011 through 2013 were assumed as the reference population. The average pedigree completeness index for one generation back was 95.9%, 97.4%, 91.2%, 89.8%, and 94.2% for appropriate breeds. Number of ancestors explaining 100% of gene pool was 186, 373, 125, 157, and 37 in CLA, CLWd, CLWs, DC, and PN, respectively. The relative proportion of inbred animals (58%, 58%, 54%, 47%, and 25%), the average inbreeding (2.7%, 1.4%, 2.5%, 3.6%, and 1.3%) and the average co-ancestry (3.1%, 1.6%, 3.3%, 4.2%, and 3.3%) were found over the past decade in analysed breeds. The expected inbreeding under random mating increased during the last 10 years in CLWs and PN and varied from 1.27% to 3.2%. The effective population size computed on the basis of inbreeding was 76, 74, 50, 35, and 83 in 2012 in CLA, CLWd, CLWs, DC, and PN, respectively. The shortest generation interval (1.45) was observed for CLWd in sire to son selection pathway. The longest generation interval obtained PN (1.95) in sire to daughter pathway. The average relative GD loss within last generation interval was 7.05%, 4.70%, 9.81%, 7.47%, and 10.46%, respectively. The relative proportion of GD loss due to genetic drift on total GD loss was 85.04%, 84.51%, 89.46%, 86.19%, and 83.68% in CLA, CLWd, CLWs, DC, and PN, respectively. All breeds were characterized by a high proportion of inbred animals, but the average inbreeding was low. The most vulnerable breeds to loss of GD are DC and PN. Therefore, a breeding program should be more oriented to prevent the increase of GD loss in these breeds.
Keywords: Effective Population Size; Expected Inbreeding; Genetic Diversity Loss; Number of Founders; Pedigree Analysis; Pedigree Completeness; Pig.
Figures
References
-
- Berg P. User’s Guide. Institute of Arhus, Institute of Genetic and Biotechnology; Tjele, Denmark: 2012. EVA version 1.75. Evolutionary algorithm for mate selection.
-
- Boichard D, Maignel L, Verrier E. The value of using probabilities of gene origin to measure genetic variability in a population. Genet Sel Evol. 1997;29:5–23.
-
- Boichard D. PEDIG: a fortran package for pedigree analysis suited for large populations. Proc. of the 7th World Congress on Genetics Applied to Livestock Production (WCGALP); Castanet-Tolosan, France [CD-Rom]: INRA; 2002. pp. 19–23.
-
- Caballero A, Toro MA. Interrelations between effective population size and other tools for management of conserved populations. Genet Res. 2000;75:331–343. - PubMed
LinkOut - more resources
Full Text Sources
Other Literature Sources
Miscellaneous